Risk and Reward
Chapter 12
Volatility Is a Feature, Not a Bug
BUG
“In the world of finance, the only black swans are
the history that investors have not read.”
– WILLIAM BERNSTEIN
ROGER FEDERER IS in the conversation for the greatest tennis player of all
time. He won over 100 professional titles, including 20 major championships, which amounted to more than $130 million in prize money. Federer was the world’s top-ranked male tennis player for 310 weeks during his illustrious career.
U.S. tennis star Andy Roddick once admitted, “My life on the line, he’s [Federer] the last guy I’d want to play.”
However, Federer’s opponents won plenty of points against him. They even won some sets. But it was rare they beat him in an entire match. In a commencement speech to Dartmouth graduates shortly after he retired, Federer reflected on his career with some mind-blowing numbers that bear this out:
In tennis, perfection is impossible. In the 1,526 singles matches I played in my career, I won almost 80% of those matches. Now, I have a question for all of you: What percentage of the POINTS do you think I won in those matches?
Only 54%. In other words, even top-ranked tennis players win barely more than half of the points they play.
When you lose every second point, on average, you learn not to dwell on every shot.
You teach yourself to think: OK, I double-faulted. It’s only a point. OK, I came to the net and I got passed again. It’s only a point.
Federer won 80% of his matches, but only 54% of the points in those matches.
One of the most dominant tennis players ever won most of his matches, but not always in dominating fashion. It was more like slight advantages over the short run that compounded through consistency over the long run.
When I heard this speech, my finance brain immediately went to the stock market. Federer’s win rates are basically the same as that of the stock market!
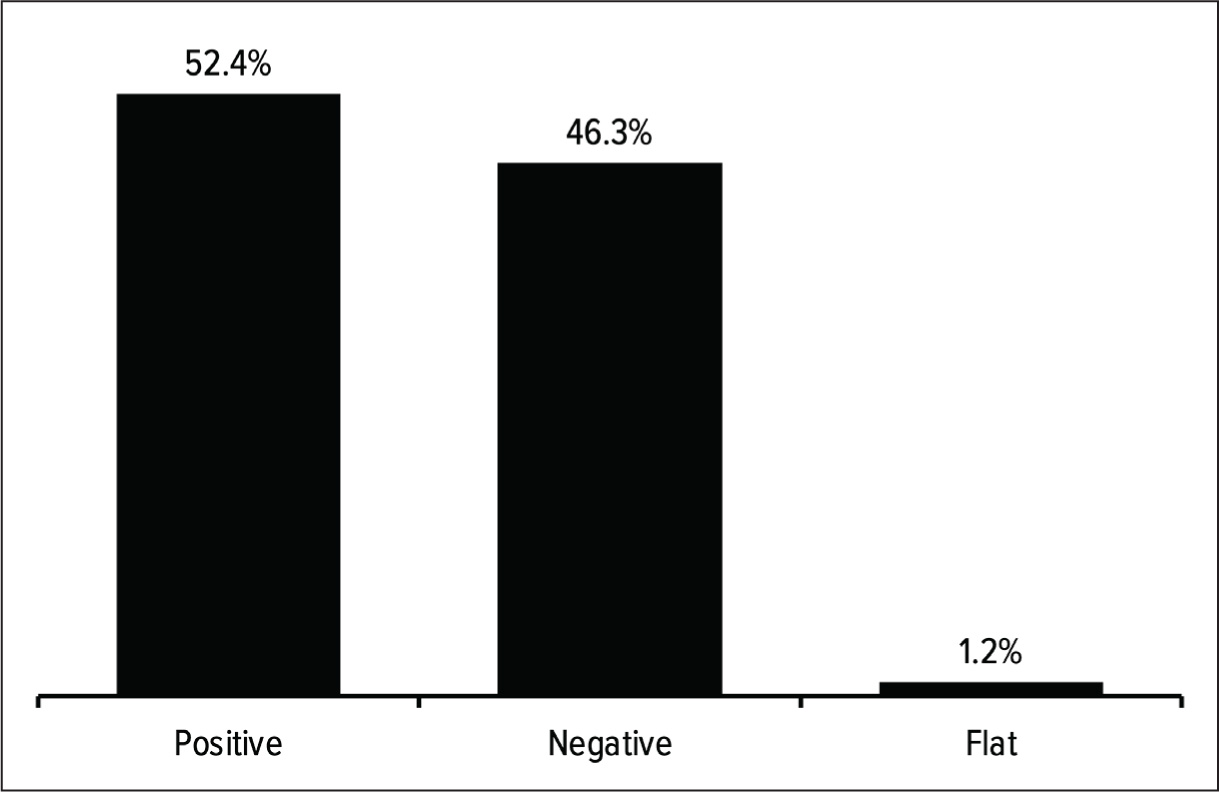
On a daily basis going back to the 1920s, the S&P 500 has been positive roughly 52% of the time, very close to Federer’s individual point win rate of 54%. The daily win rate of the stock market isn’t much better than a flip of the coin, as shown in Figure 12.1.
Small edges add up in the stock market too. The average daily gain in the U.S. stock market going back to 1928 is just 0.03%. This is shown in Figure 12.2.
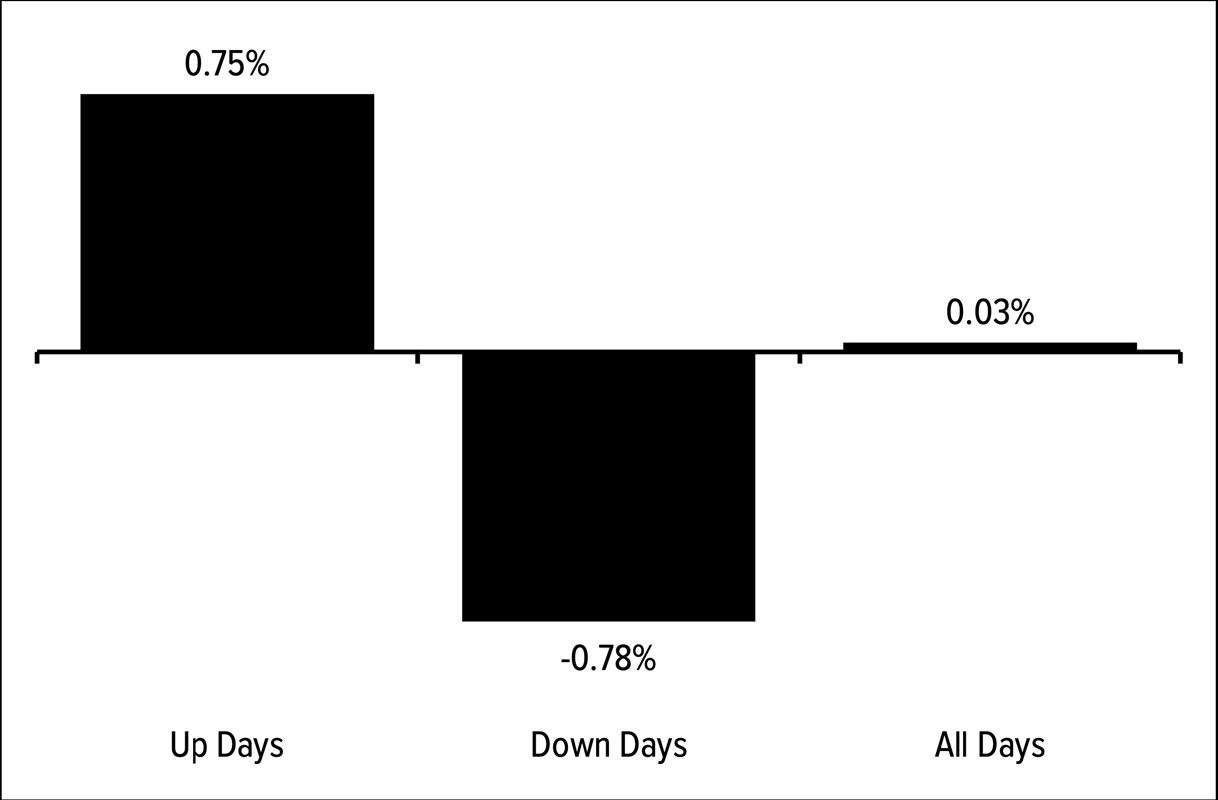
These figures reflect price-only returns, excluding dividends. On a price-only basis, the S&P 500 was up close to 39,000% from 1928 to 2024. From 0.03% each day to 39,000% over 96 years. And when you factor in reinvested dividends, the total return skyrockets to an astonishing 982,000%. No one actually has an investing time horizon that long, but the benefits of compounding small daily gains in the stock market can be truly remarkable.
If Roger Federer gave up every time he lost a point, he wouldn’t have 20 grand slam titles. Likewise, if you put too much weight on short-term outcomes in the stock market, you’re not going to succeed as an investor. You must be willing to lose some points in the short term to win some matches in the long term. Volatility is the price of admission.
The best casino ever
Investors often compare the stock market to a casino, but that analogy never made sense to me. In an actual casino the house has the edge, so the longer you play, the higher your probability of losing. The stock market is the opposite.
Some people blindly assume the stock market is rigged. Yes, the stock market is rigged against you if you’re looking for easy money. But it’s also rigged in favor of long-term investors. This is because the win rate in the stock market increases the longer you play.
Looking at post-Second World War data starting in 1950, the win rates for the S&P 500 over the long run are phenomenal (see Figure 12.3)!
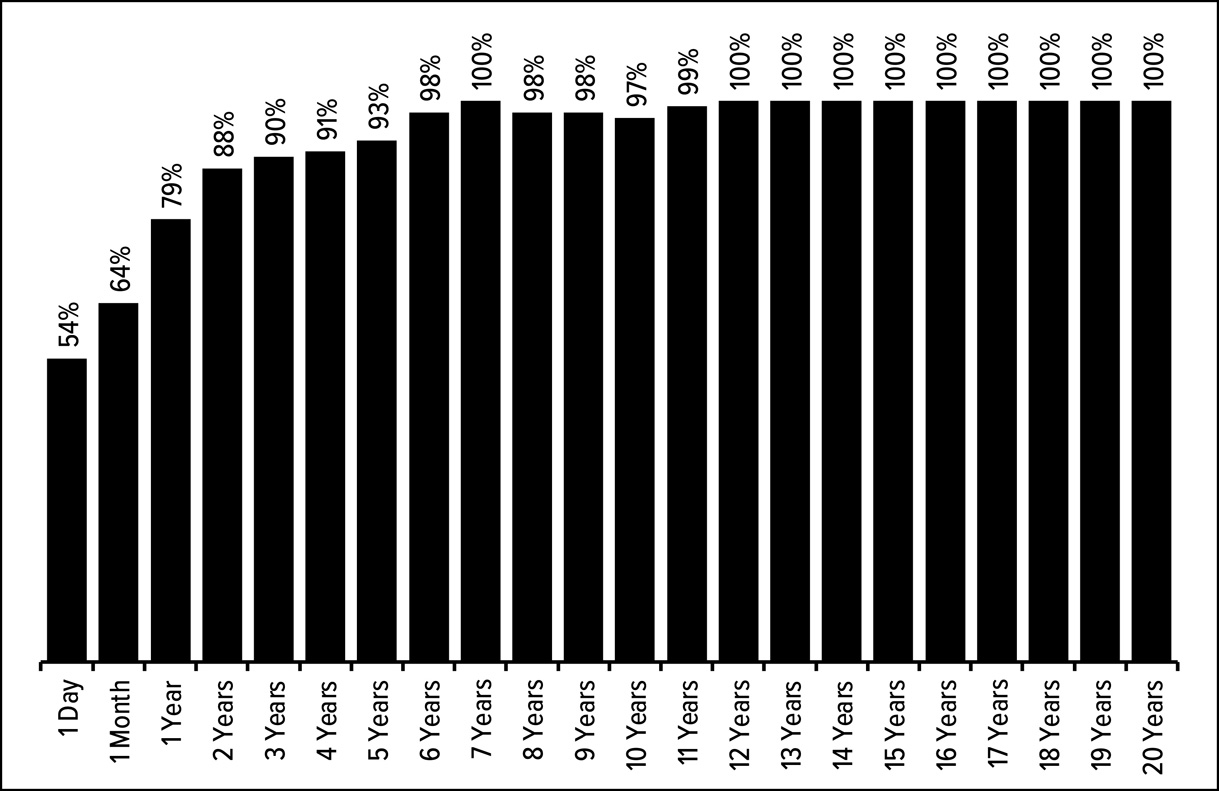
The win rates increase from a little better than a coin flip on a one-day time horizon to quickly above 90% for holding periods of more than three years. It’s remarkable to consider the U.S. stock market was never down over any 12-year window in this 75 years of data. And although there were some lost decades (more on this in Chapter 17), the stock market was positive in 97% of all 10-year total returns.
Minor advantages that compound over long time horizons can do wonders for your wealth. Despite this fact, you have to survive volatility to earn these wonderful results. To repeat my stock market philosophy: Most of the time the stock market goes up but sometimes it goes down. Losses are a feature, not a bug.
For example, you’re highly likely to experience a correction in a given year in the stock market, as shown in Figure 12.4.
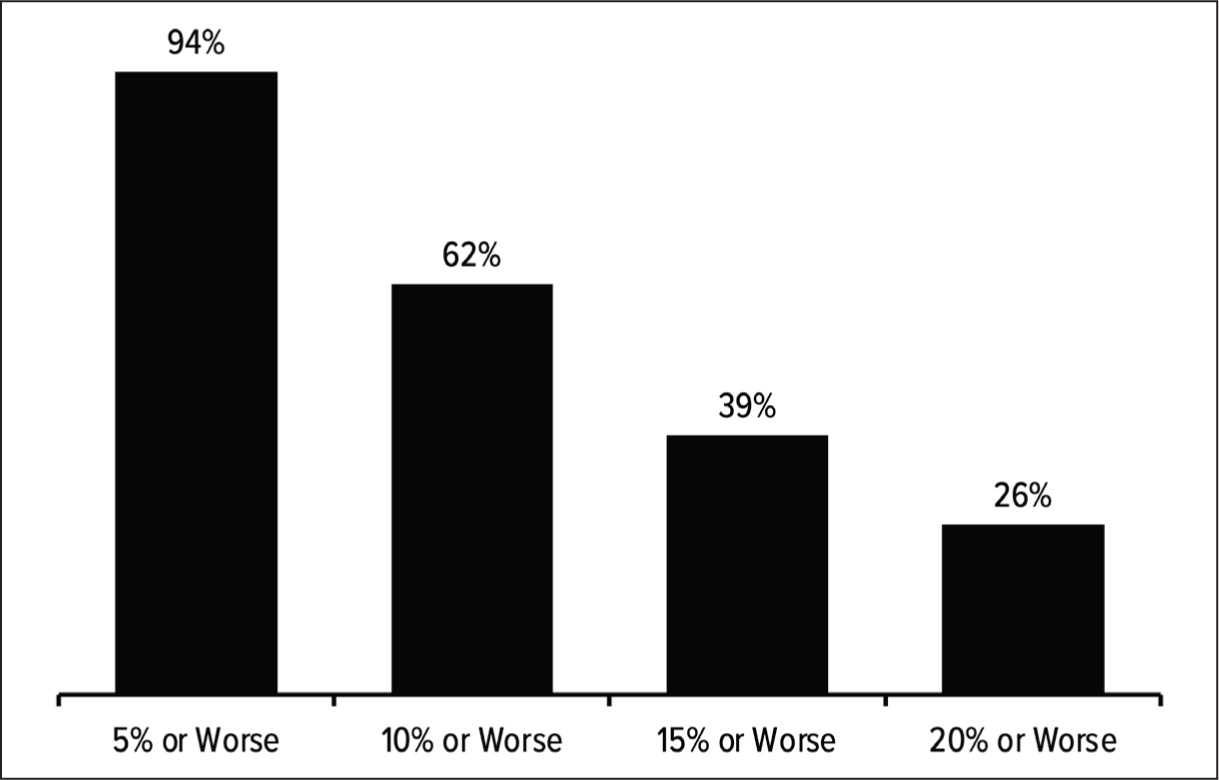
This chart shows that nearly two-thirds of the time, there has been a double-digit correction at some point in a given calendar year. Just 6% of all years since 1928 have seen a maximum peak-to-trough drawdown of less than 5%.
Interestingly, even when the stock market has experienced a correction, it’s likely the market still finishes the year with gains. Figure 12.5 shows the calendar year returns along with the peak-to-trough drawdowns for the S&P 500.
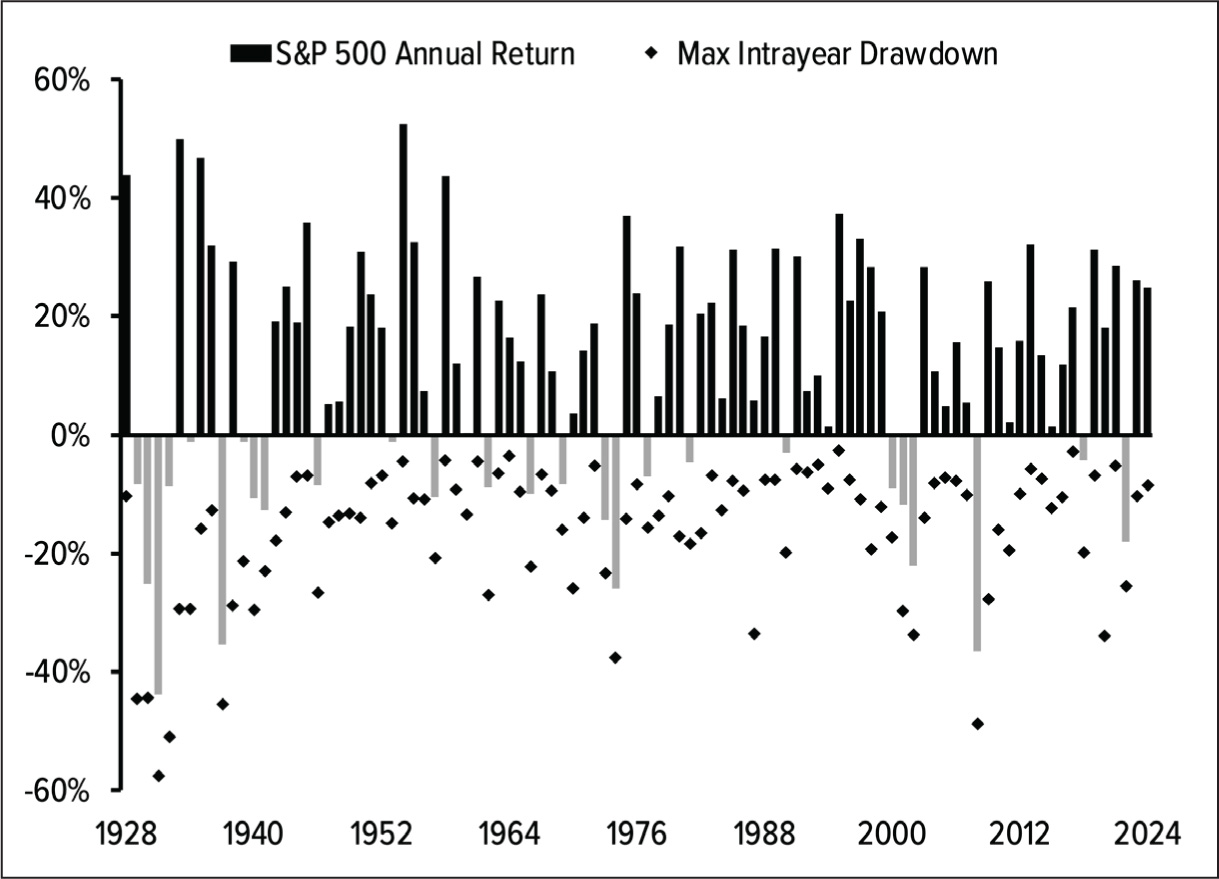
The average peak-to-trough drawdown during a given calendar year from 1928 to 2024 was -16.3%. In 35 of the 61 years with a double-digit correction, the S&P 500 still finished the year in positive territory.
Allow me to repeat that – out of the 61 years with a correction of 10% or worse, the stock market still finished the year with gains in 57% of those years. And 24 of those 31 up years had a year-end gain of 10% or more! That means two out of every five years with a double-digit correction at some point along the way still finished with double-digit gains.
In that same time frame, the stock market experienced 36 years with gains of 20% or more. Out of those 36 years, there has been a correction of 10% or worse on the way to those gains in 17 years. So in almost half of all years when the U.S. stock market was up 20% or more, there has been a double-digit correction during the journey to those wonderful gains.
Even when the stock market goes up, sometimes it has to go down to get there.
I realize that’s a lot of numbers I just threw at you. The most important takeaway from all of this historical data is that volatility is a buying opportunity, not something to run from.
Getting used to drawdowns
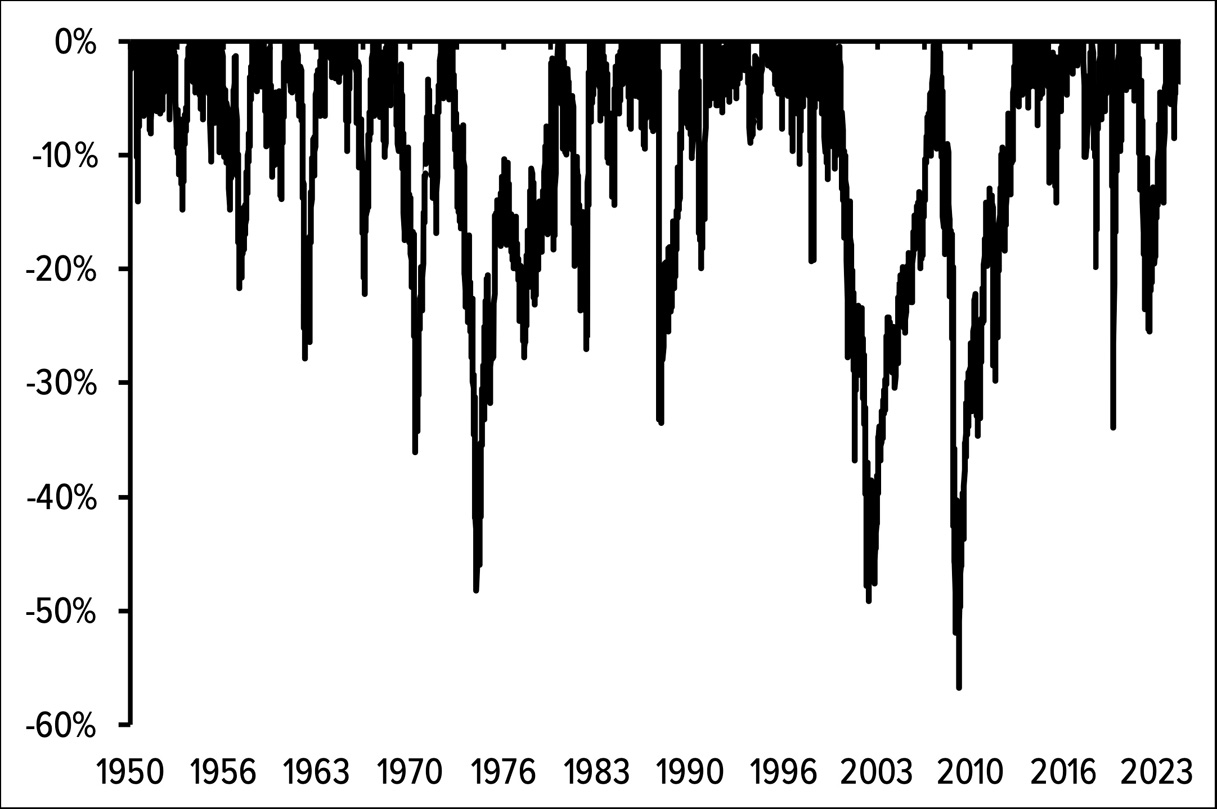
As an investor in the stock market, you have to get used to being in a state of drawdown. Going back to 1950, the S&P 500 has hit new all-time highs in just 7% of all trading days. If we invert, that means the stock market has been down from all-time highs 93% of the time. And you would have been down 10% or worse more than one-third of the time.
Table 12.1 shows how often the stock market experiences declines of different sizes.
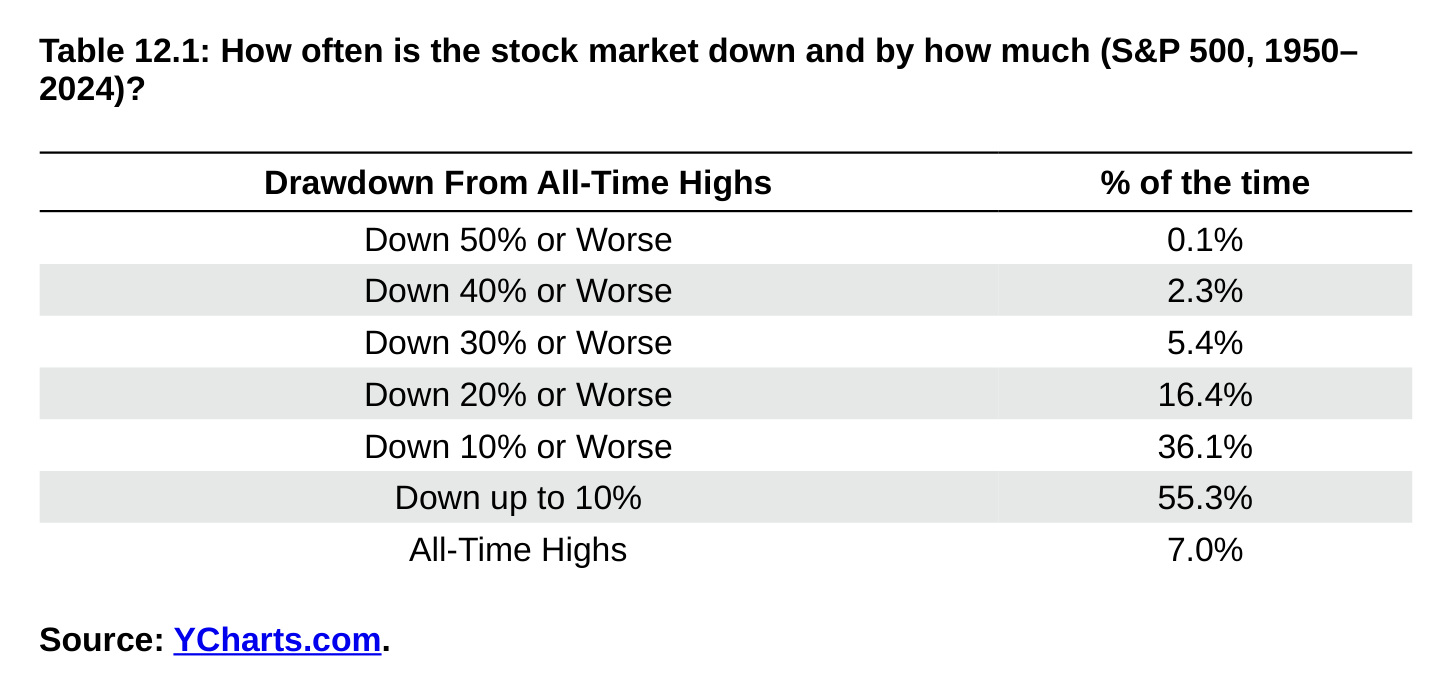
Table 12.1: How often is the stock market down and by how much (S&P 500, 1950– 2024)? Drawdown From All-Time Highs % of the time Down 50% or Worse 0.1% Down 40% or Worse 2.3% Down 30% or Worse 5.4% Down 20% or Worse 16.4% Down 10% or Worse 36.1% Down up to 10% 55.3% All-Time Highs 7.0% Source: YCharts.com.
If you’re not comfortable sitting through losses, you’re never going to make it in the stock market.
In the 20th century, we endured a pandemic, the Great Depression, two world wars, the Vietnam War, the Korean War, the Cold War, the Gulf War, 19 recessions, high inflation, low inflation, deflation, high rates, low rates, Black Monday, a handful of stock market crashes and dozens of corrections along the way.
In the 21st century (so far), we endured 9/11, the Iraq war, the war in Afghanistan, the pandemic, the Great Financial Crisis, the highest inflation in 40 years, negative oil prices, a lost decade in the stock market bookended by separate 50% crashes and a handful of recessions.
I could keep going. History is littered with unspeakable tragedies and yet we as a species somehow forge ahead. We create. We innovate. We grow. We make more money. Life goes on. Things eventually get better. Despite all of the nasty stuff that occurred the stock market was up 10% per year. Can I guarantee this will continue? Of course not. Does that mean you should abandon the stock market? I hope not.
Short-term vs. long-term volatility
In Wall Street parlance, volatility is considered risk. And the way finance people define risk is through mathematical formulas. For volatility, they calculate the standard deviation of returns. You might be a little rusty on statistics so allow me to explain.
Imagine you have a classroom full of students and measure everyone’s height. Some of those students will be taller, some will be shorter and some will be close to average. Standard deviation is how much the student heights vary around the average. If the range is wide – spanning from Yao Ming (7’6”) to Muggsy Bogues (5’3”) – the standard deviation will be relatively high. Conversely, if most heights cluster closely around the average, the standard deviation will be lower. That’s volatility.
The stock market has a rather high standard deviation. The returns are all over the place from year to year. On the other hand, bonds and cash are asset classes associated with relatively low volatility. They have lower highs and lower lows than the stock market.
However, this doesn’t tell the whole story. Volatility depends on your time frame. In the short run, bonds and cash can provide a buffer against volatility. Assuming you need to spend down part of your portfolio, rebalance into the pain, or desire an emotional hedge against the stock market, the lack of volatility in bonds and cash is a huge benefit.
Stocks can be insanely volatile in the short run, but in the long run, the volatility of stock returns falls considerably. Figure 12.6 shows the standard deviation of monthly returns for stocks, bonds and cash over various time frames.
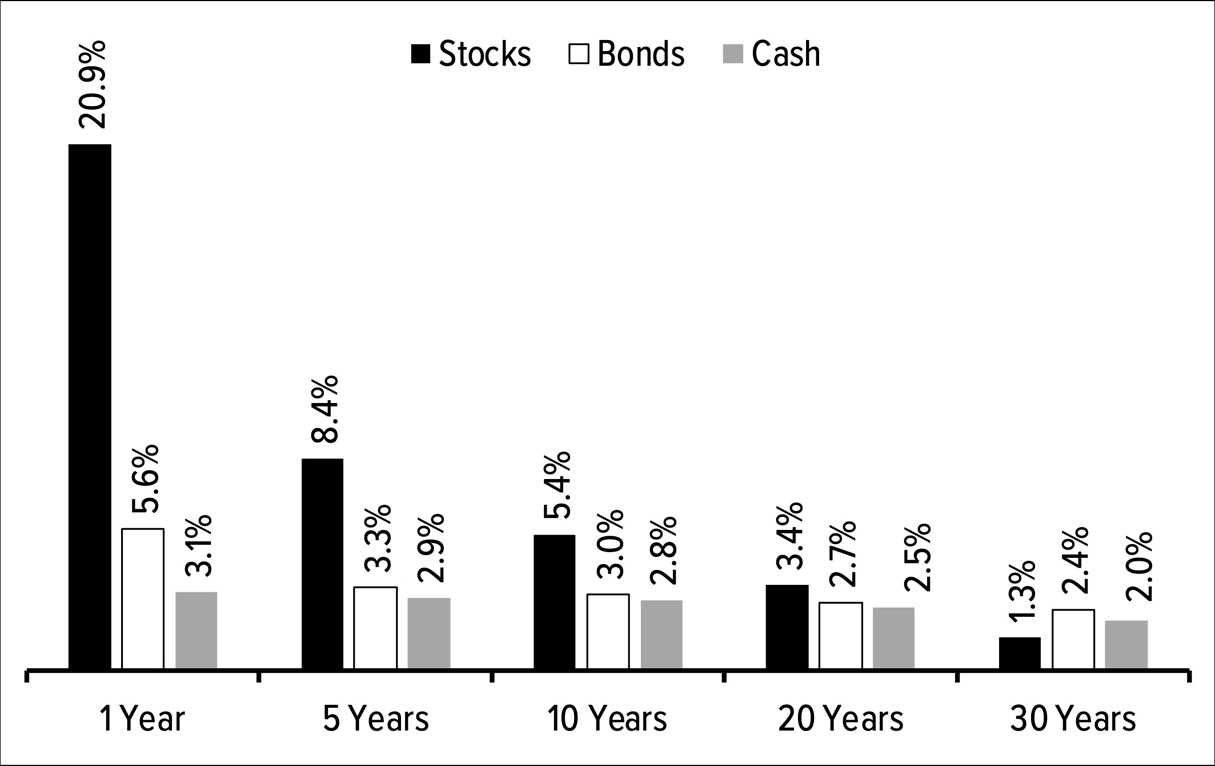
You can see that stock market volatility is much higher over rolling one-
year returns. The best 12-month return for the S&P 500 over this period was 163%. The worst 12-month return was -68%. This range from high to low is wide enough to drive 17 cement trucks through. But the variance of returns narrows considerably as you extend the time horizon. Incredibly, stock market returns are less volatile than bonds and cash over a 30-year time frame! Stocks are always at risk of a drawdown or crash, but the variability in your returns goes down the longer you hold them.
To bring this discussion full circle, Roger Federer experienced plenty of volatility in the short run. He lost a lot of points in his matches. But the range of outcomes decreased the further out you extend his tennis matches. Federer’s winning percentage for games (58%) was higher than his winning percentage for points (54%). He won more sets (76%) than games and more matches (82%) than sets.
Historical information like this can help put things into perspective, but historical data is rarely enough to help you sleep at night or change your behavior. Market averages tell a story, but no one’s experience in the markets is ever average in the moment. The past is easy because we know what happened, but the future is messy since the uncertainty of the potential outcomes cannot be reduced.
If you need liquidity in the short term for spending purposes, that money shouldn’t be invested in the stock market. If you have a time horizon measured in years and decades as opposed to days and months, the stock market makes more sense. Your mix of long-term and short-term assets depends on your ability to withstand losses with equanimity and your desire to sleep soundly at night. Every financial decision you make is a series of trade-offs and investing is no different in that regard.
Volatility is only a risk if it causes you to overreact and make unnecessary mistakes. One of the reasons the stock market provides such lovely returns in the long run is because it can be so darn confusing in the short run. You don’t get the gains without living through the losses.
Every correction feels like it will never end while you are in it and with the benefit of hindsight always looks like a buying opportunity. No one ever said investing was easy. That’s why the stock market offers you a risk premium – it’s risky!
At least in the short term. You don’t get the result shown in Figure 12.7. . .
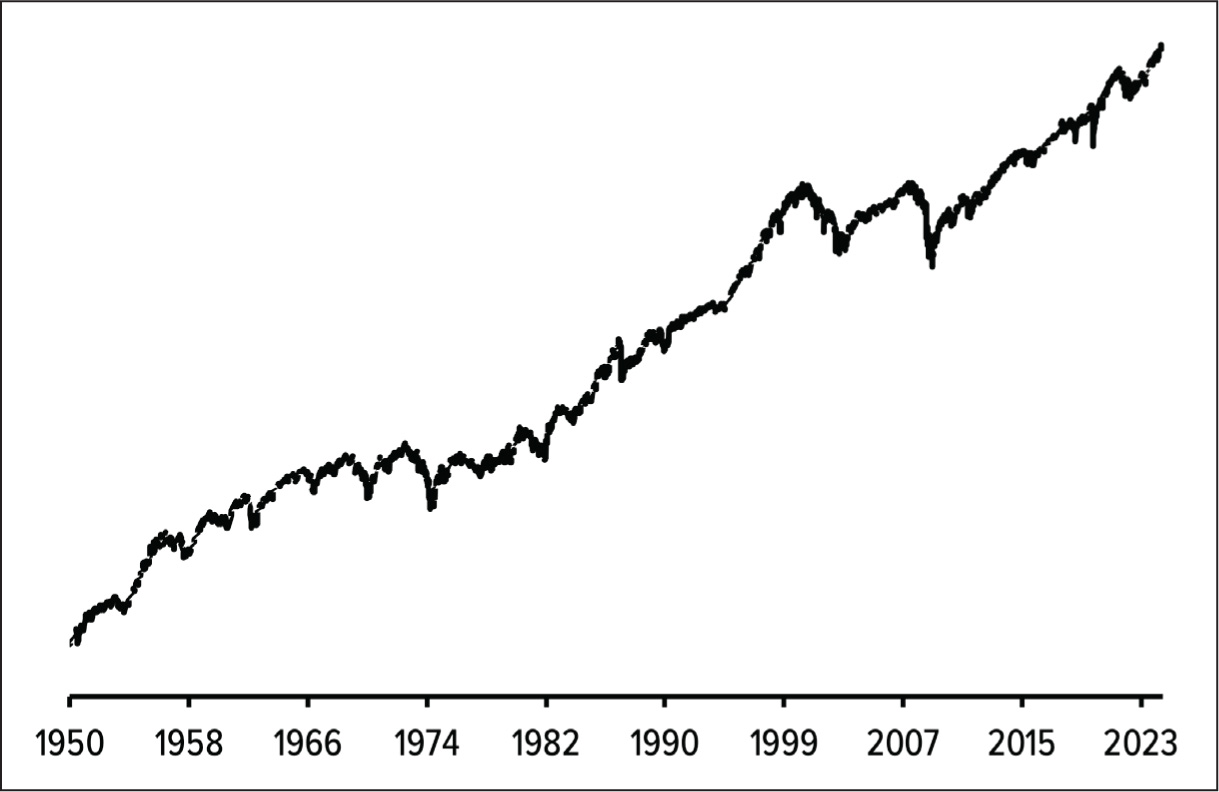
. . .without living through the drawdowns shown in Figure 12.8.