Risk and Reward
Chapter 1
It Was the Worst of Times
“Most people get interested in stocks when everyone
else is. The time to get interested is when no one else
is.”
– WARREN BUFFETT
SHARK WEEK PREMIERED on the Discovery Channel in 1988.
The series was originally about promoting the conservation of sharks and clearing up any misconceptions about these enigmatic fish. But that’s not what the majority of viewers took away from the show. As Shark Week grew in popularity, viewers became more concerned about shark attacks because shark attacks make for good TV.
Researchers conducted a study on different groups of people to examine how watching the show influenced their perception of sharks. One group was shown footage of violent shark attacks, while the other watched non-violent shark footage. The more exposure participants had to violent videos, the more fearful they became of sharks. This fear persisted even when public service announcements at the end of each episode emphasized the rarity of shark attacks. Although Shark Week was intended to be educational, viewers were primarily drawn to the worst-case scenarios. People tend to disregard statistics, but react strongly to visuals of a massive predator with a menacing fin and sharp teeth capable of ripping you to shreds. Funny how that works.
Sharks are not the most deadly animals in the world – not even close. In fact, the most deadly animal in the world is actually the teeny-tiny mosquito, which kills hundreds of thousands of people each year. Mosquito Week just wouldn’t have the same ring to it, but humans are far more likely to die from a mosquito bite than a reenactment of Jaws. Lightning kills almost 50 people a year, while deer accidents kill another 150 people or so. More than 300 people drown in the bathtub each year. Shark attacks account for around five to six deaths per year, on average. You can see the most deadly animals in Figure 1.1.
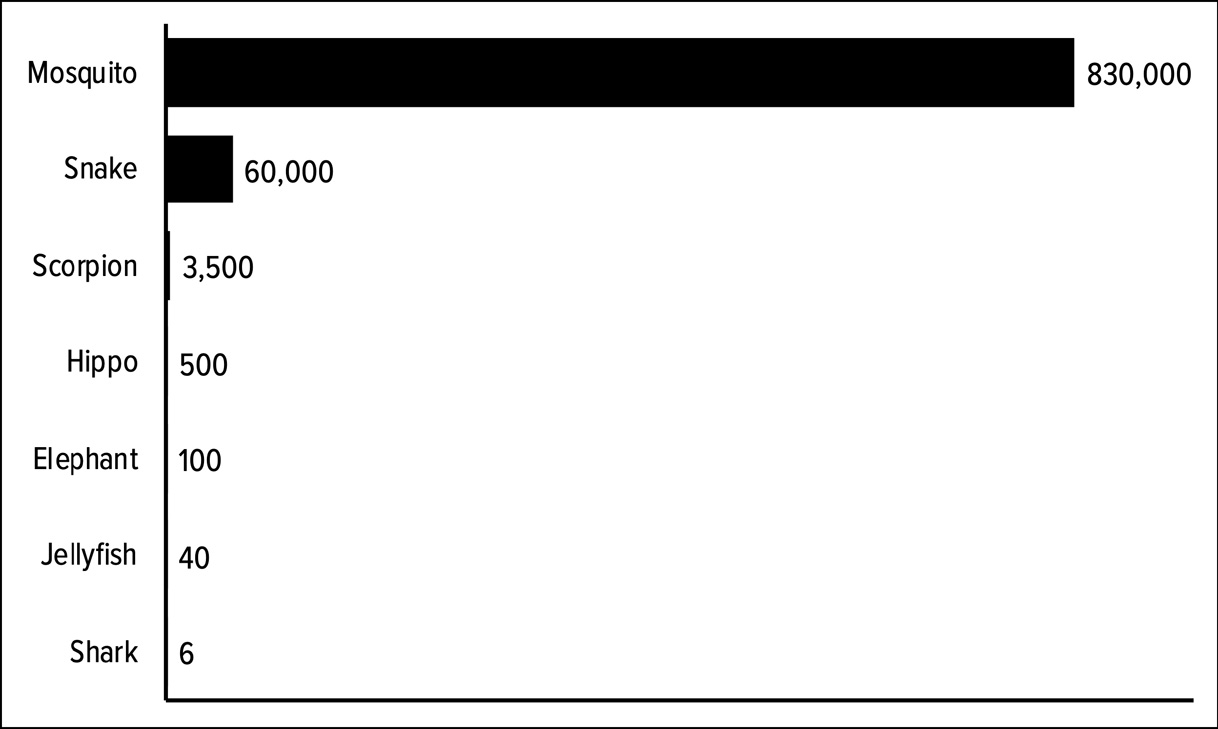
Those other risks don’t make for a very compelling story so people spend all their time worrying about the low-probability events they read about in the headlines.
I could really tie up this analogy into a neat bow if only there were another place where people misperceive the risks involved. A place where people are swayed by scary narratives and headlines, instead of paying attention to the evidence. A place where people fall prey to the constant drumbeat of scare tactics, noise, and clickbait to make decisions.
Wait a minute. . . that’s the stock market! The more shark attacks you watch, the more fearful you become of sharks. The same is true of the stock market. The more you focus on the downturns, the more fearful you become of them.
Let’s take a look at all of the shark attacks that have occurred in the financial markets – the worst of the worst – to get it all out in the open.
First, Table 1.1 shows the 10 worst days in the U.S. stock market (represented by the S&P 500) going back to 1928.
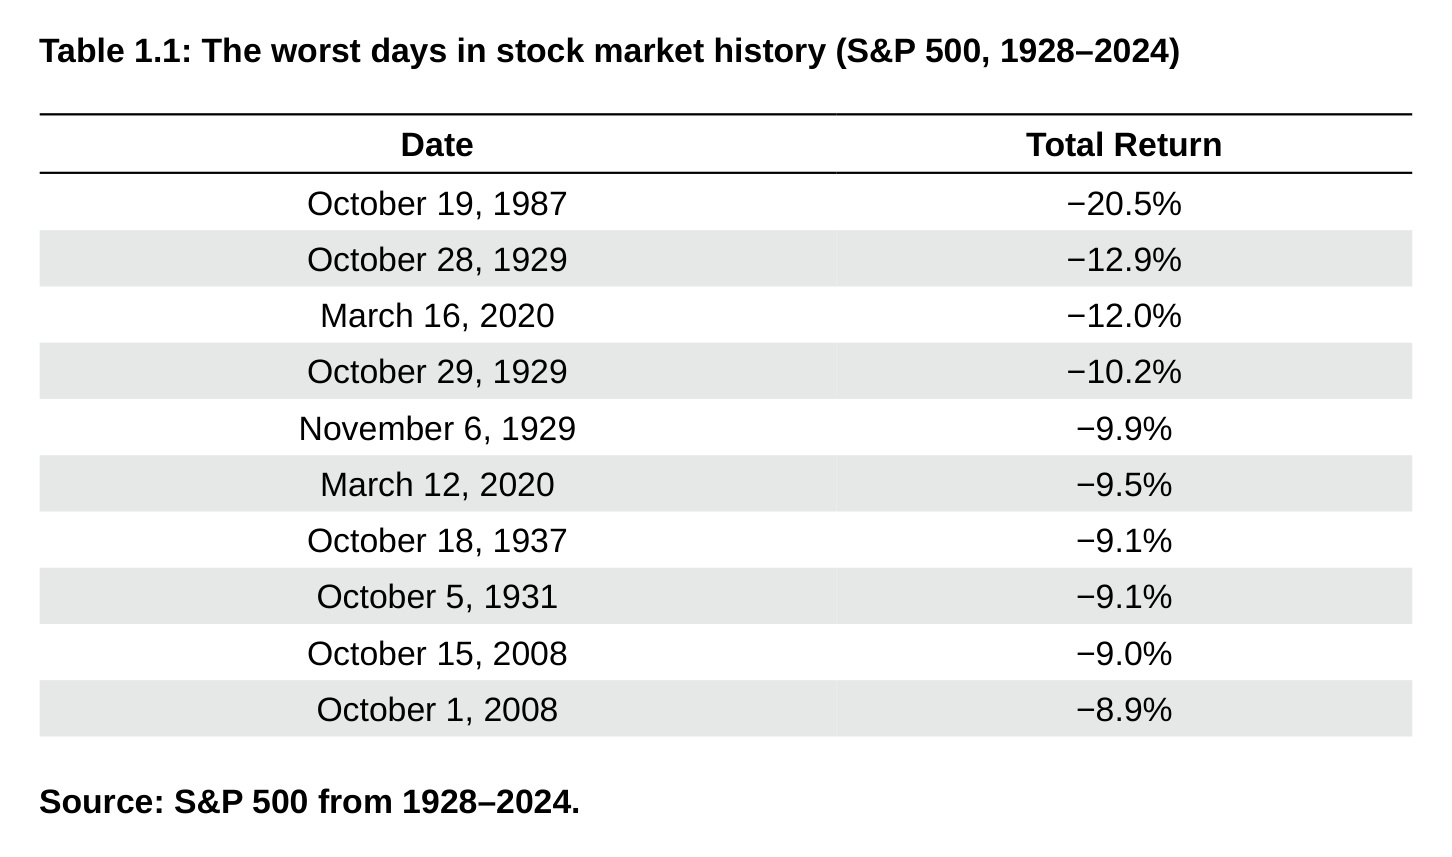
Table 1.1: The worst days in stock market history (S&P 500, 1928–2024) Date Total Return October 19, 1987 −20.5% October 28, 1929 −12.9% March 16, 2020 −12.0% October 29, 1929 −10.2% November 6, 1929 −9.9% March 12, 2020 −9.5% October 18, 1937 −9.1% October 5, 1931 −9.1% October 15, 2008 −9.0% October 1, 2008 −8.9% Source: S&P 500 from 1928–2024.
Black Monday on October 19, 1987 was the worst day in stock market history. The stock market saw one-fifth of its value evaporate in a single day. It’s hard to explain how jarring this event was for investors at that time. Twenty percent of your money invested in stocks just vanished. The rest of the list includes days during the Great Depression, the 2008 Great Financial Crisis and the Covid Crash in 2020.*
Now let’s take a look at the 10 worst months in U.S. stock market history, in Table 1.2.
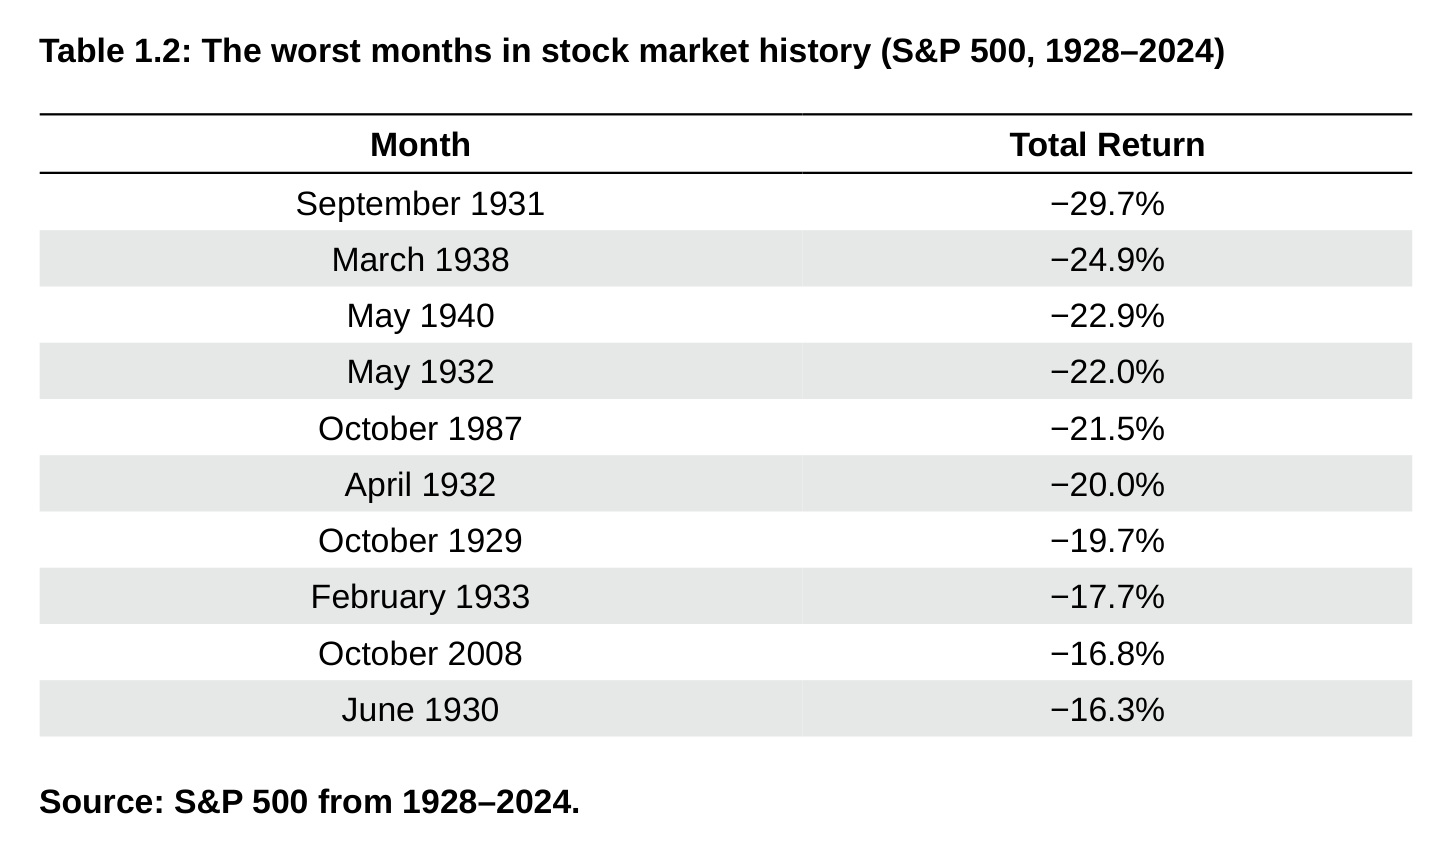
Table 1.2: The worst months in stock market history (S&P 500, 1928–2024) Month Total Return September 1931 −29.7% March 1938 −24.9% May 1940 −22.9% May 1932 −22.0% October 1987 −21.5% April 1932 −20.0% October 1929 −19.7% February 1933 −17.7% October 2008 −16.8% June 1930 −16.3% Source: S&P 500 from 1928–2024.
Imagine you have a $1 million stock portfolio and suddenly a month later it’s now worth $800,000 or $700,000. That’s how quickly money can be vaporized in the stock market.
The 1930s saw that happen in back-to-back months during April and May of 1932. In total the stock market was down almost 40% in the course of two months. Just brutal. It’s hard to believe, but there have been just as many 20% or worse down months as there have been 20% or worse down years.
Table 1.3 shows the 10 worst years in U.S. stock market history.
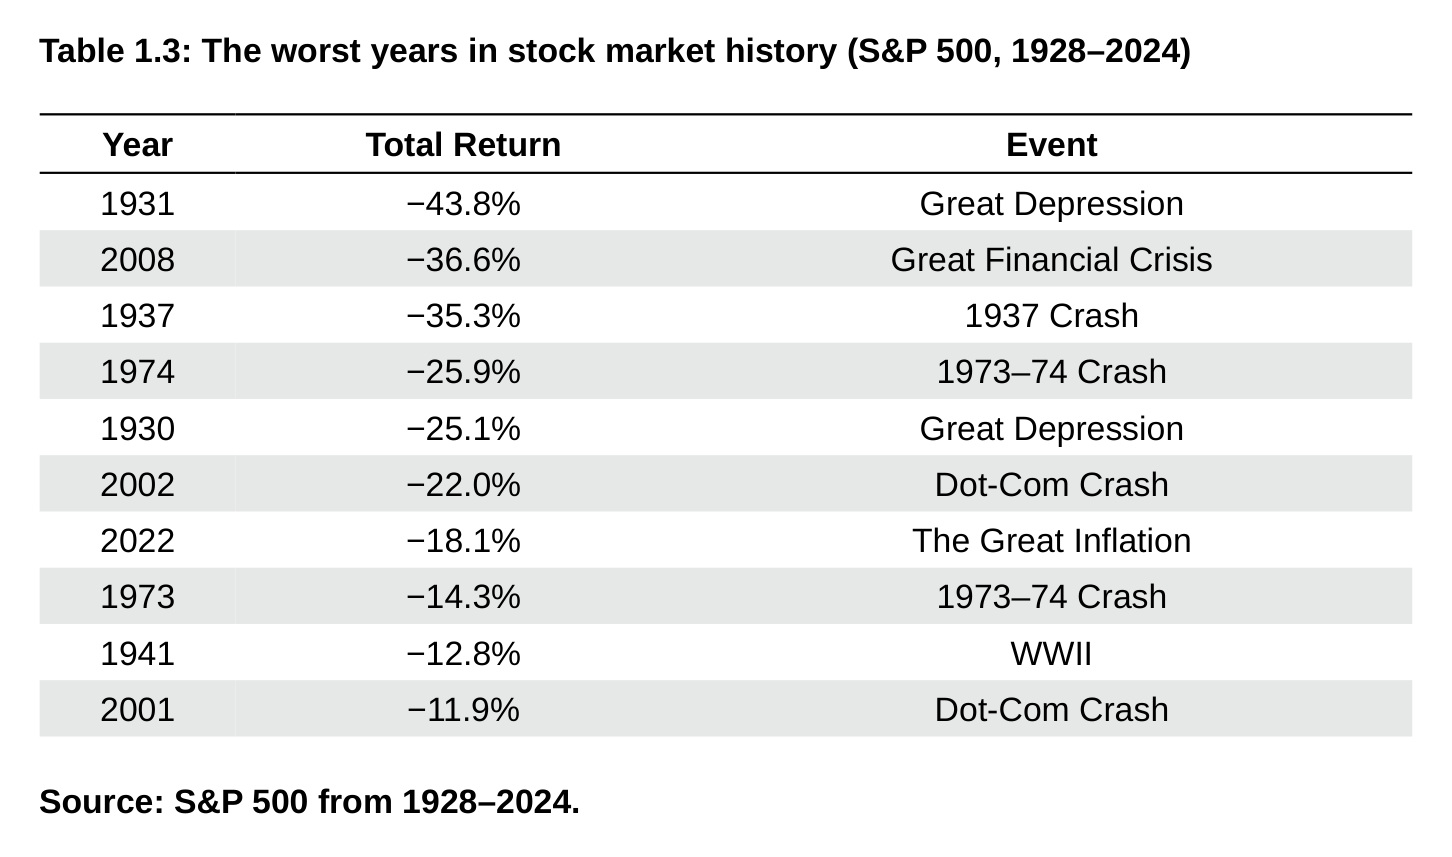
Table 1.3: The worst years in stock market history (S&P 500, 1928–2024) Year Total Return Event 1931 −43.8% Great Depression 2008 −36.6% Great Financial Crisis 1937 −35.3% 1937 Crash 1974 −25.9% 1973–74 Crash 1930 −25.1% Great Depression 2002 −22.0% Dot-Com Crash 2022 −18.1% The Great Inflation 1973 −14.3% 1973–74 Crash 1941 −12.8% WWII 2001 −11.9% Dot-Com Crash Source: S&P 500 from 1928–2024.
These tables are littered with the worst economic and financial environments in history. The bad times tend to cluster together. Three of the worst years took place during the Great Depression and its aftermath in the 1930s. There were also three big down years that took place during the first decade of the 21st century in 2001, 2002 and 2008. Financial crises and bad economic times lead to poor outcomes in the stock market that can be difficult to stomach.
When you experience these cash incinerators, the fluctuations can tempt you into making mistakes. Volatility in stock prices leads to volatility in your emotions. The severity of market crashes such as these over days, months, and years can make even the most disciplined investors question their investment sanity.
What if the market doesn’t come back? What if stocks keep crashing? How am I ever going to recover from this?
Some investors can handle holding all of their investable assets in a 100% stock portfolio. If you have the correct emotional disposition and time horizon, you may be able to justify going all in on stocks. If you’re going to invest your entire portfolio in stocks, you need to remain calm during the worst days, months and years. Every long-term investor will get tested in the short term.
The good news is that you can recover from these stock attacks if you can wait them out.
It was the best of times after the worst of times
The worst of times are painful but never last forever. Investing when stocks are down is a wonderful strategy because it usually leads to higher returns.
Table 1.4 shows what happened one, five and 10 years following the worst months in stock market history.
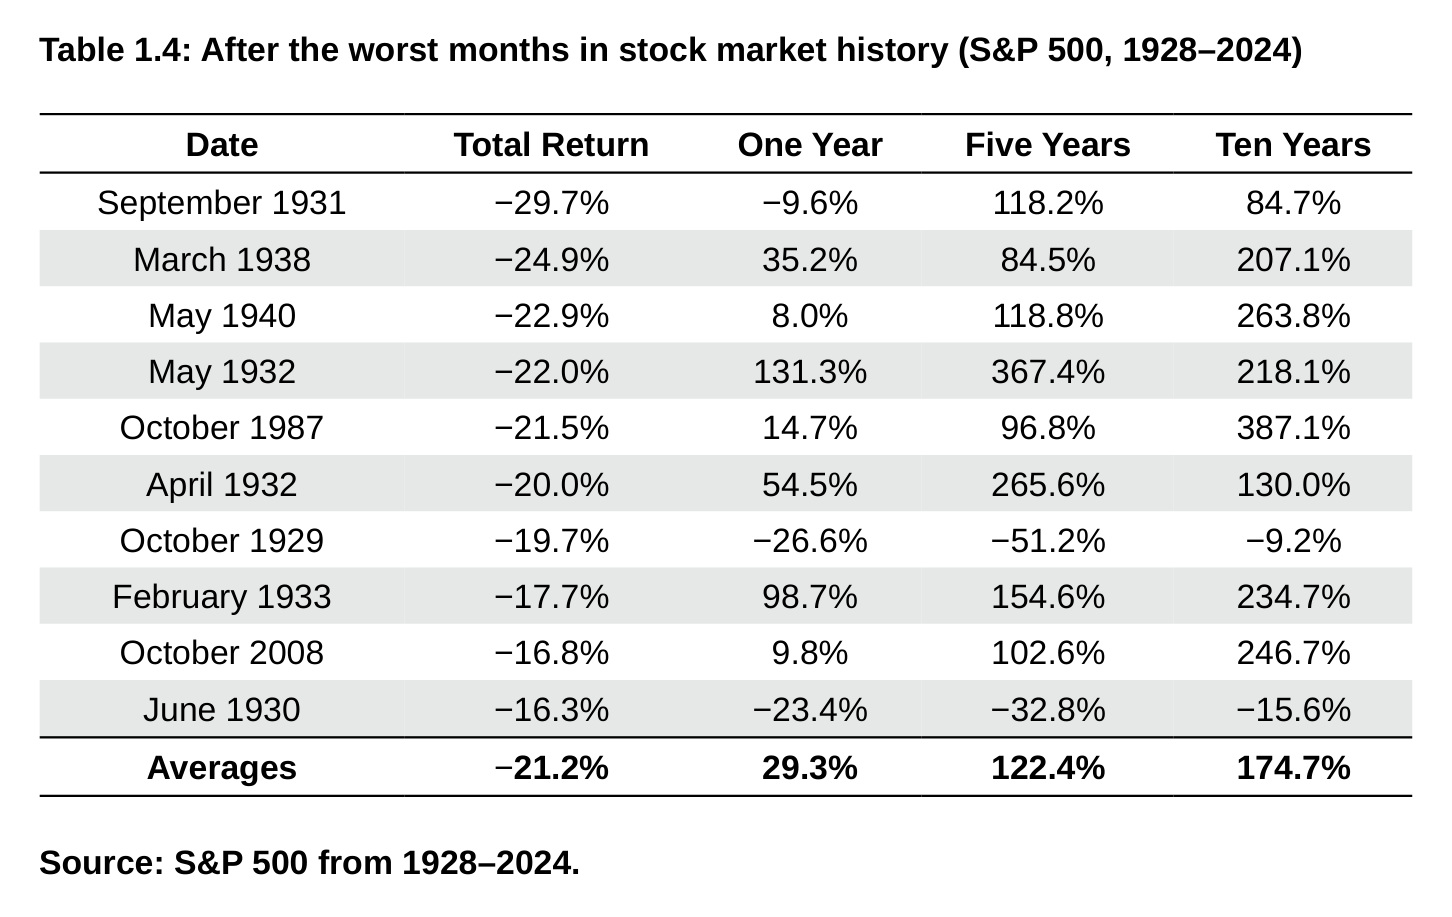
Table 1.4: After the worst months in stock market history (S&P 500, 1928–2024) Date Total Return One Year Five Years Ten Years September 1931 −29.7% −9.6% 118.2% 84.7% March 1938 −24.9% 35.2% 84.5% 207.1% May 1940 −22.9% 8.0% 118.8% 263.8% May 1932 −22.0% 131.3% 367.4% 218.1% October 1987 −21.5% 14.7% 96.8% 387.1% April 1932 −20.0% 54.5% 265.6% 130.0% October 1929 −19.7% −26.6% −51.2% −9.2% February 1933 −17.7% 98.7% 154.6% 234.7% October 2008 −16.8% 9.8% 102.6% 246.7% June 1930 −16.3% −23.4% −32.8% −15.6% Averages −21.2% 29.3% 122.4% 174.7% Source: S&P 500 from 1928–2024.
Take a look at what happened following the 1987 crash. It was the fastest bear market in history. At the time people worried the market was signaling a repeat of the Great Depression. Yet stocks were up 15%, 97%, and 387% respectively over the ensuing one, five and 10 years. If you had the courage to buy in the midst of a panic, you were handsomely rewarded.
Good returns tend to follow bad returns. The price of admission to the
stock market is bone-crushing volatility, a lumpy return stream and the anguish of witnessing a chunk of your life savings evaporate before your eyes. In exchange, you get long-term returns above the rate of inflation and compounding that can earn you multiples of your initial investment in the greatest wealth-building machine ever created.
Buying stocks when they’re on sale
Despite all of the terrible losses you can encounter in the stock market over the short run, the long-term track record is still quite impressive. From 1928 to 2024, the S&P 500 achieved an annual return of 9.9% per year. Those returns include every one of the worst days, months and years outlined in this chapter.
In that time, the stock market was positive in roughly three out of every four years. The average positive year saw gains of around 21%, while the average down year was closer to a loss of 14%. Investing in stocks involves both big losses and big gains.
To keep things simple, let’s use +20% for the up years and -15% for the down years since I like nice round numbers. If the stock market went on a four-year run with returns of +20%, +20%, +20% and -15%, the annualized return in these four years would be +10% per year.
Still with me? Let’s say you plan on saving $1,000 a year for the next 40 years and get this same return stream of gains every three out of four years. Now let’s look at two different scenarios where the annual returns at the end are exactly the same:
Scenario A: You get -15% annual losses in the first 10 years followed by 30 years of +20% annual gains. Scenario B: You get 30 years of +20% annual gains followed by 10 years of -15% annual losses.
If you’re a periodic investor in the stock market, which scenario should you prefer?
In Scenario A, where your returns were dreadful in the first 10 years but wonderful in the ensuing 30 years, your final balance after 40 years would be $2.5 million.
In Scenario B, where your returns were wonderful in the first 30 years but dreadful in the final 10 years, your final balance after 40 years would be just over $200,000.
In each scenario, the market’s average annual return is 10%, but the results are miles apart.
How can this be possible? In Scenario A, you’re saving and investing during your most important compounding years, when you’re young, during a brutal bear market. In Scenario B, you’re saving and investing during your most important years during a rip-roaring bull market. It’s more advantageous to buy in at lower prices when you’re young because compound interest takes time to work (more on this in Chapter 14).
Obviously, these examples are not realistic. If the stock market fell 15% for 10 straight years, that’s a loss of 80%. Gaining 20% for 30 straight years would give you a return of nearly 24,000%.
But the point remains: If you are just starting out as an investor, the best thing that could happen to you is a series of down markets. You should get down on your hands and knees and pray to the god of Gordon Gekko that stocks will fall when you are putting more money to work in the market. When stocks go on sale you don’t want to run out of the store, you want to lean into the pain and buy more!
Sometimes the worst of times can be the best of times. It all depends on your age, time horizon and place in life as a saver or investor. If you are saving money on a regular basis, lower stock prices are a good thing. It means you get to buy stocks on sale! Poor returns aren’t always a bad thing as long as they lead to better returns down the road.
However, if you need to spend down a portion of your portfolio, or if you desire less volatility so you can sleep more soundly at night, then adding another asset class can help.
The 60/40 portfolio
Now that we’ve established the wild price swings you can see in the stock market, it’s only natural to inquire what options you have besides gritting your teeth and sitting through big losses.
There are two ways to manage risk in stocks: you can diversify or you
can extend your investment time horizon. Let’s take a closer look at each of these forms of risk management.
Sometimes you diversify to control your emotions during short-term volatility. Sometimes you diversify because you have spending needs and don’t want to sell stocks when they are down. And sometimes you desire a source of dry powder so you can rebalance into the pain when stocks are on sale.
Traditionally, the main diversifier for stocks has been bonds. To show how this works, let’s look at the 26 years in which the U.S. stock market finished with a loss from 1928 through 2024. Table 1.5 provides a look at each of those down years along with the corresponding returns for U.S. Treasuries.
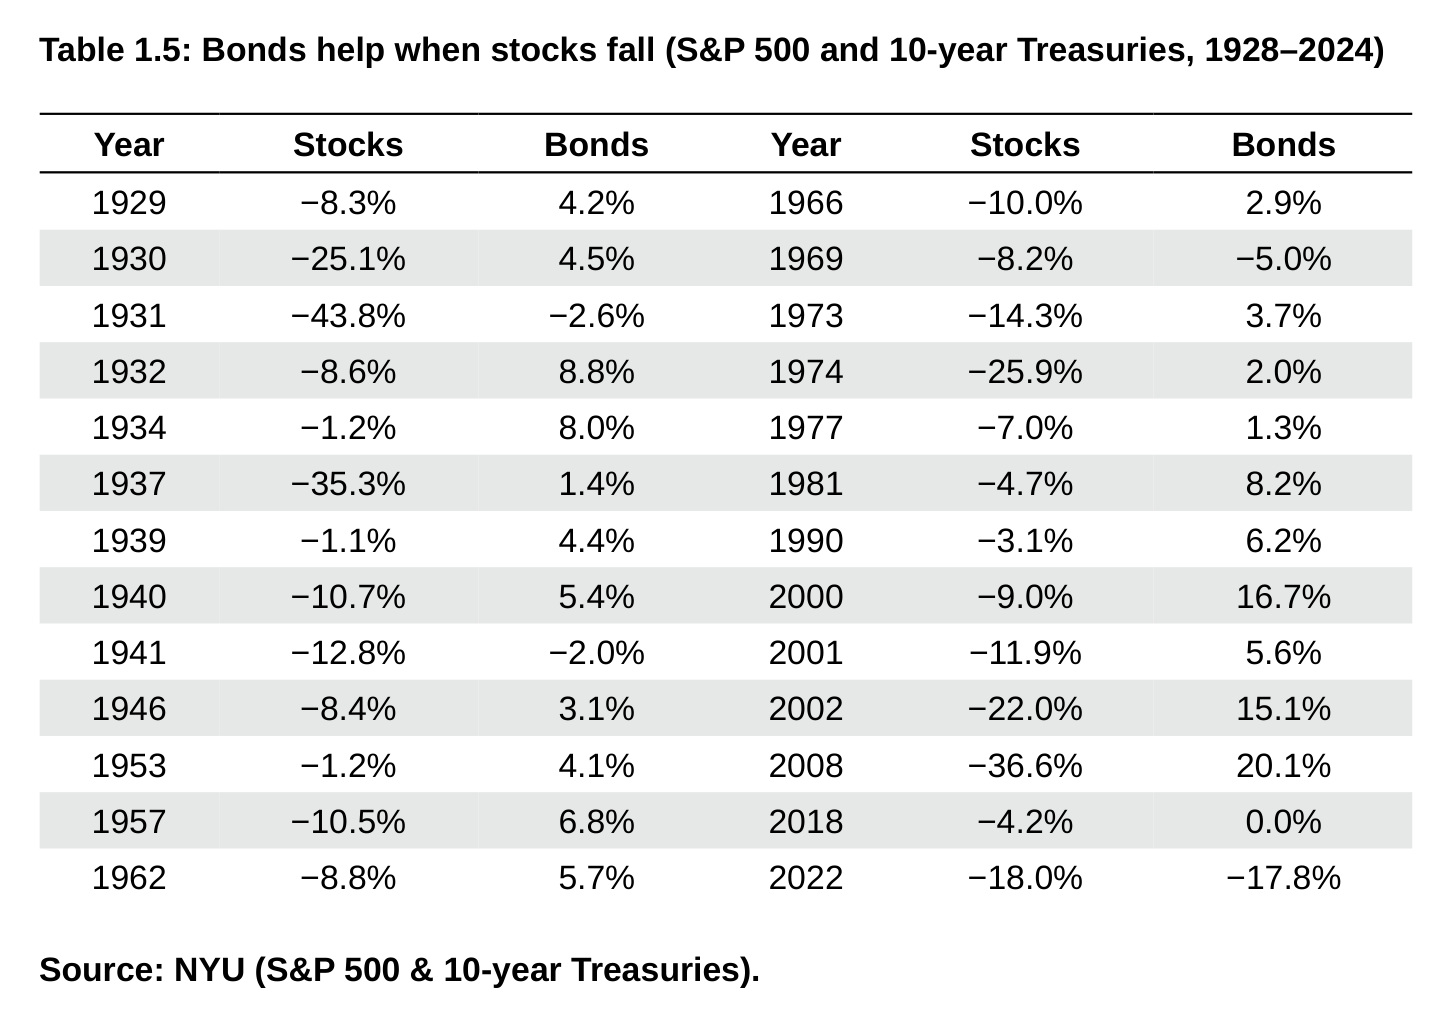
Table 1.5: Bonds help when stocks fall (S&P 500 and 10-year Treasuries, 1928–2024) Year Stocks Bonds Year Stocks Bonds 1929 −8.3% 4.2% 1966 −10.0% 2.9% 1930 −25.1% 4.5% 1969 −8.2% −5.0% 1931 −43.8% −2.6% 1973 −14.3% 3.7% 1932 −8.6% 8.8% 1974 −25.9% 2.0% 1934 −1.2% 8.0% 1977 −7.0% 1.3% 1937 −35.3% 1.4% 1981 −4.7% 8.2% 1939 −1.1% 4.4% 1990 −3.1% 6.2% 1940 −10.7% 5.4% 2000 −9.0% 16.7% 1941 −12.8% −2.0% 2001 −11.9% 5.6% 1946 −8.4% 3.1% 2002 −22.0% 15.1% 1953 −1.2% 4.1% 2008 −36.6% 20.1% 1957 −10.5% 6.8% 2018 −4.2% 0.0% 1962 −8.8% 5.7% 2022 −18.0% −17.8% Source: NYU (S&P 500 & 10-year Treasuries).
The average return for stocks in these 26 down years was -13.5%. During those same years, bonds averaged gains of 4.3%, meaning that boring old U.S. government bonds outperformed stocks by nearly 18 percentage points on average when stocks finished the year down.
Diversification didn’t work all the time. There were four years when stocks and bonds were both down in the same year.* Still, high-quality bonds have generally provided a ballast to a portfolio when stocks are getting bludgeoned.
Having seen the performance of bonds in the worst years for stocks, it makes sense that some investors opt for a combined portfolio of stocks and bonds. The 60/40 (60% in stocks and 40% in bonds) is the portfolio of choice for many investors who want exposure to the growth power of stocks, but also desire an offset.
Let’s take a look at the worst years ever for a 60/40 portfolio (Table 1.6).
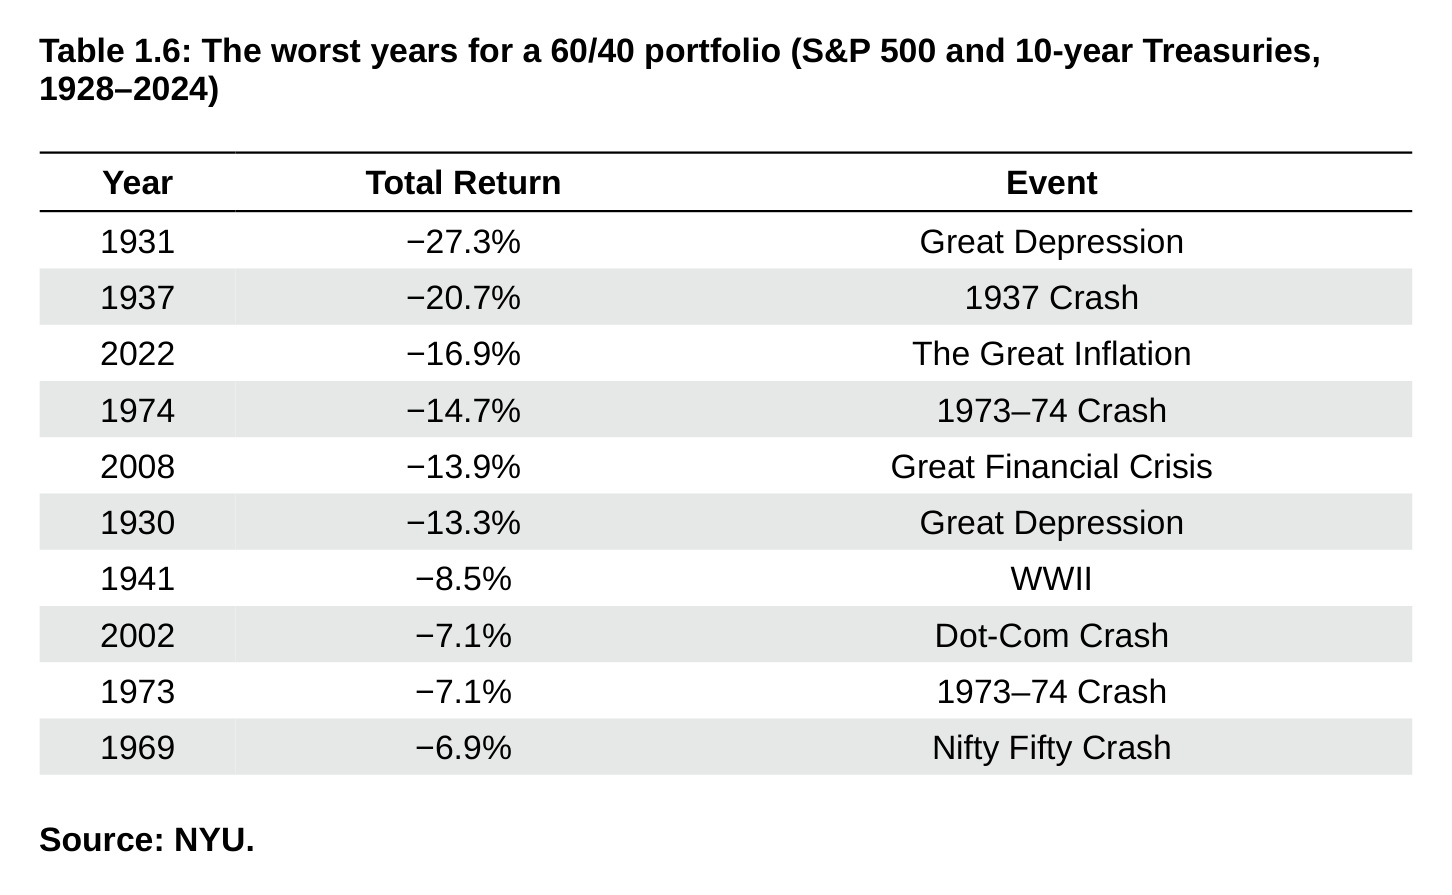
Table 1.6: The worst years for a 60/40 portfolio (S&P 500 and 10-year Treasuries, 1928–2024) Year Total Return Event 1931 −27.3% Great Depression 1937 −20.7% 1937 Crash 2022 −16.9% The Great Inflation 1974 −14.7% 1973–74 Crash 2008 −13.9% Great Financial Crisis 1930 −13.3% Great Depression 1941 −8.5% WWII 2002 −7.1% Dot-Com Crash 1973 −7.1% 1973–74 Crash 1969 −6.9% Nifty Fifty Crash Source: NYU.
Many of the worst years for a 60/40 portfolio are the same as the worst years for the U.S. stock market. This makes sense, since the 60% in stocks carries much more risk than the 40% in bonds. It should provide some comfort to know that in the 97 years from 1928 to 2024, there were just six times when a 60/40 portfolio finished the year down double-digits. A 20% down year occurred just twice. There are no guarantees the future will be like the past, but these are pretty good historical odds.
Now let’s look at the worst 10-year returns for a 60/40 portfolio. Table
1.7 shows the ending dates of 10-year periods and the total return of a 60/40 portfolio in that decade.
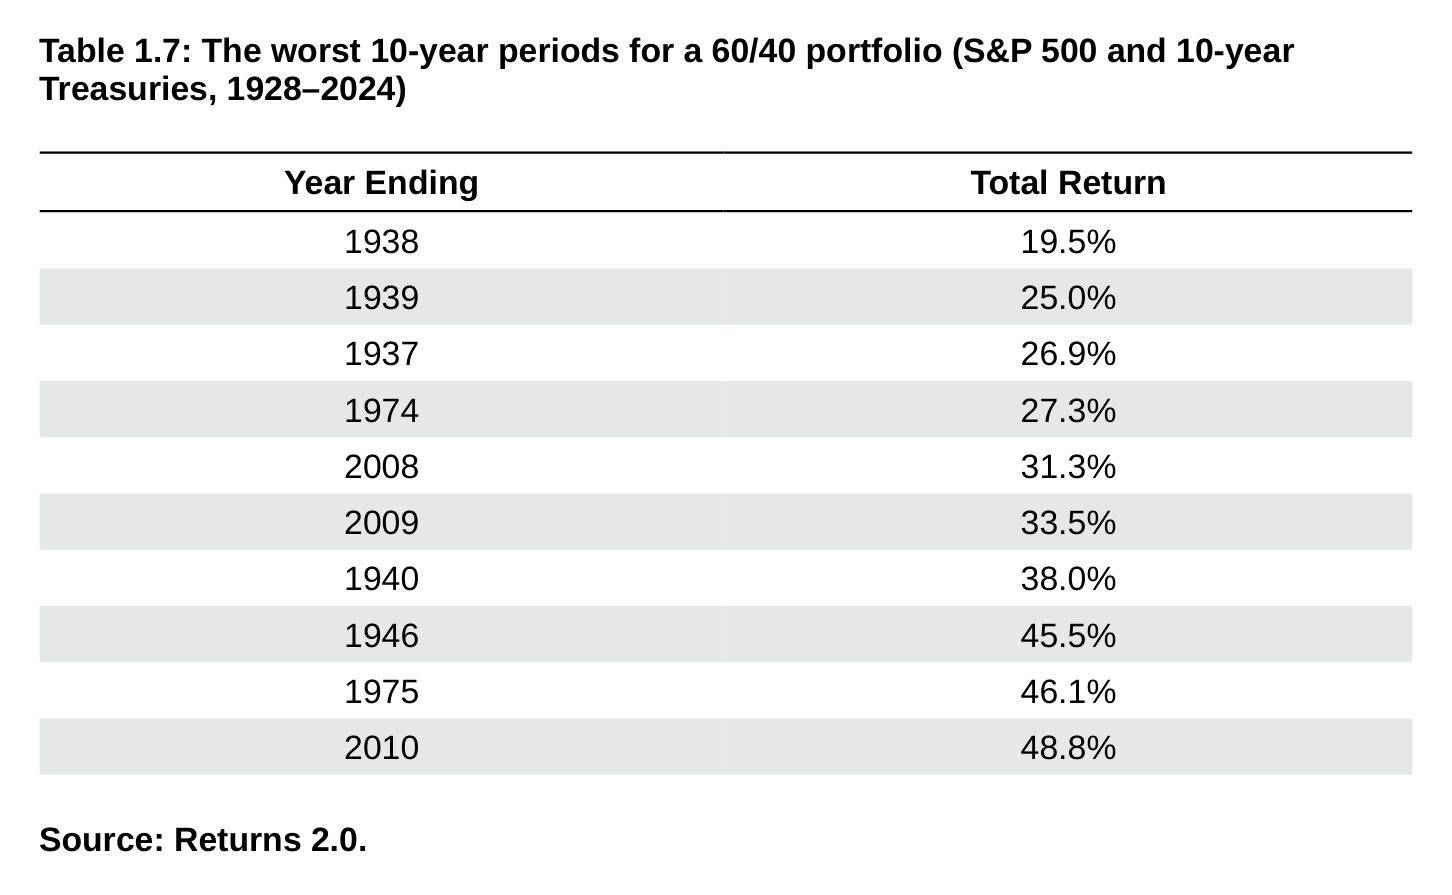
Table 1.7: The worst 10-year periods for a 60/40 portfolio (S&P 500 and 10-year Treasuries, 1928–2024) Year Ending Total Return 1938 19.5% 1939 25.0% 1937 26.9% 1974 27.3% 2008 31.3% 2009 33.5% 1940 38.0% 1946 45.5% 1975 46.1% 2010 48.8% Source: Returns 2.0.
By my calculations, there has never been a negative return over 10 years for a 60/40 portfolio as of a calendar year-end. Could it happen? Absolutely. There is no such thing as always or never in the financial markets. But again, this is a good track record.
Finally, let’s look at the worst 20-year returns for a 60/40 portfolio. Table 1.8 shows the ending dates of 20-year periods and the total return of a 60/40 portfolio in those 20-year blocks.
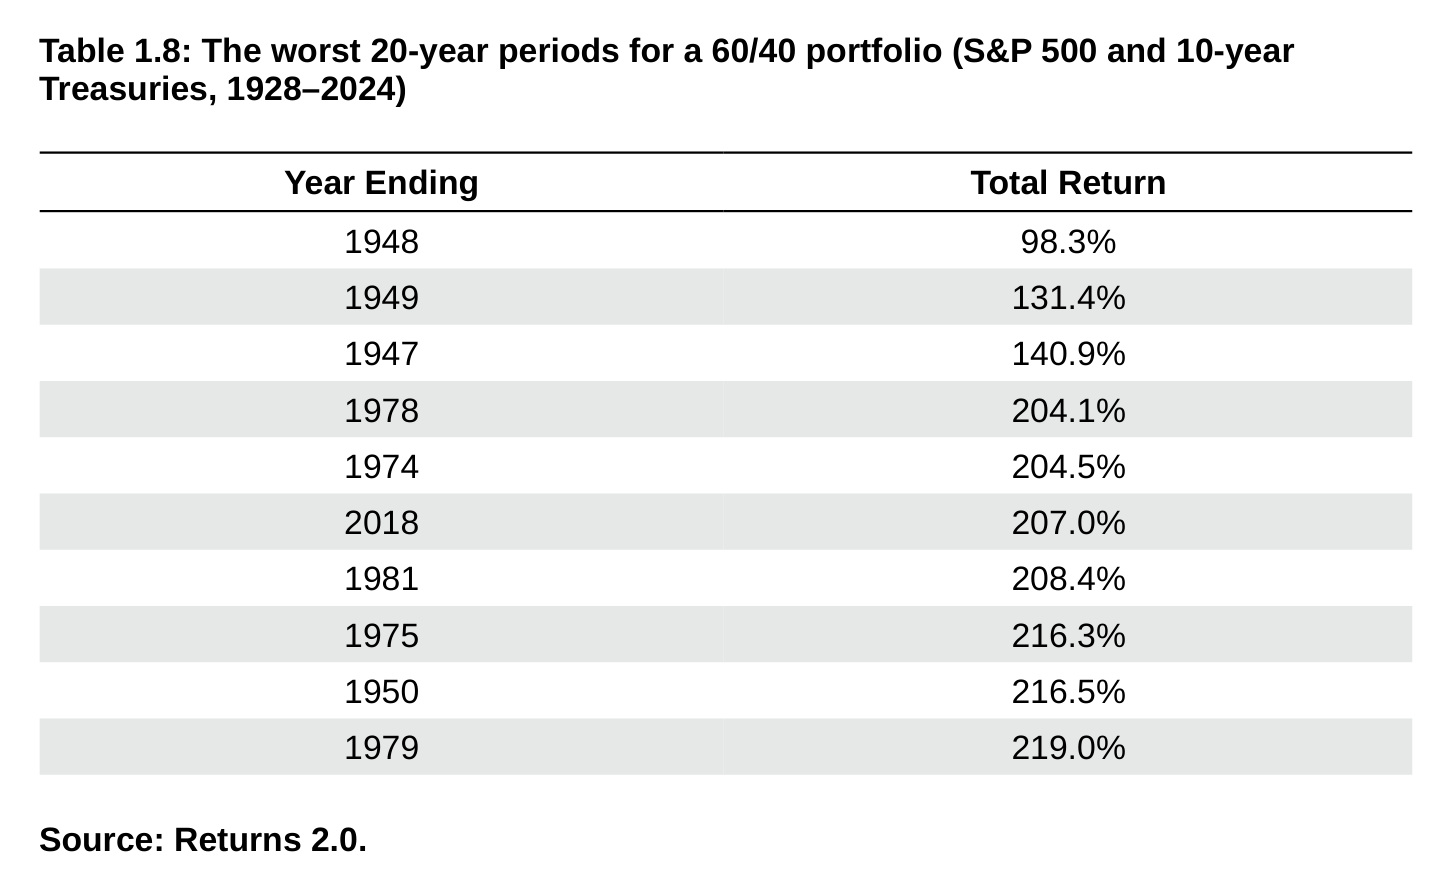
Table 1.8: The worst 20-year periods for a 60/40 portfolio (S&P 500 and 10-year Treasuries, 1928–2024) Year Ending Total Return 1948 98.3% 1949 131.4% 1947 140.9% 1978 204.1% 1974 204.5% 2018 207.0% 1981 208.4% 1975 216.3% 1950 216.5% 1979 219.0% Source: Returns 2.0.
As with most worst-case historical performance numbers, the starting point for the bottom of the barrel was 1929. With a total return of +98.3%, the 20 years from 1929 to 1948 saw an annual gain of 3.4%, where you doubled your money in total. That’s not bad for a worst-case scenario.
Past performance is not indicative of future results, but sometimes it is helpful to zoom out when thinking about how bad things could get. Extending your time horizon remains one of the most powerful investment strategies when all else fails.
How to win
The win rate for a 60/40 portfolio over various time frames tells the story here too. Using rolling monthly returns, Figure 1.2 shows the improvement in win rates as you extend your time horizon.
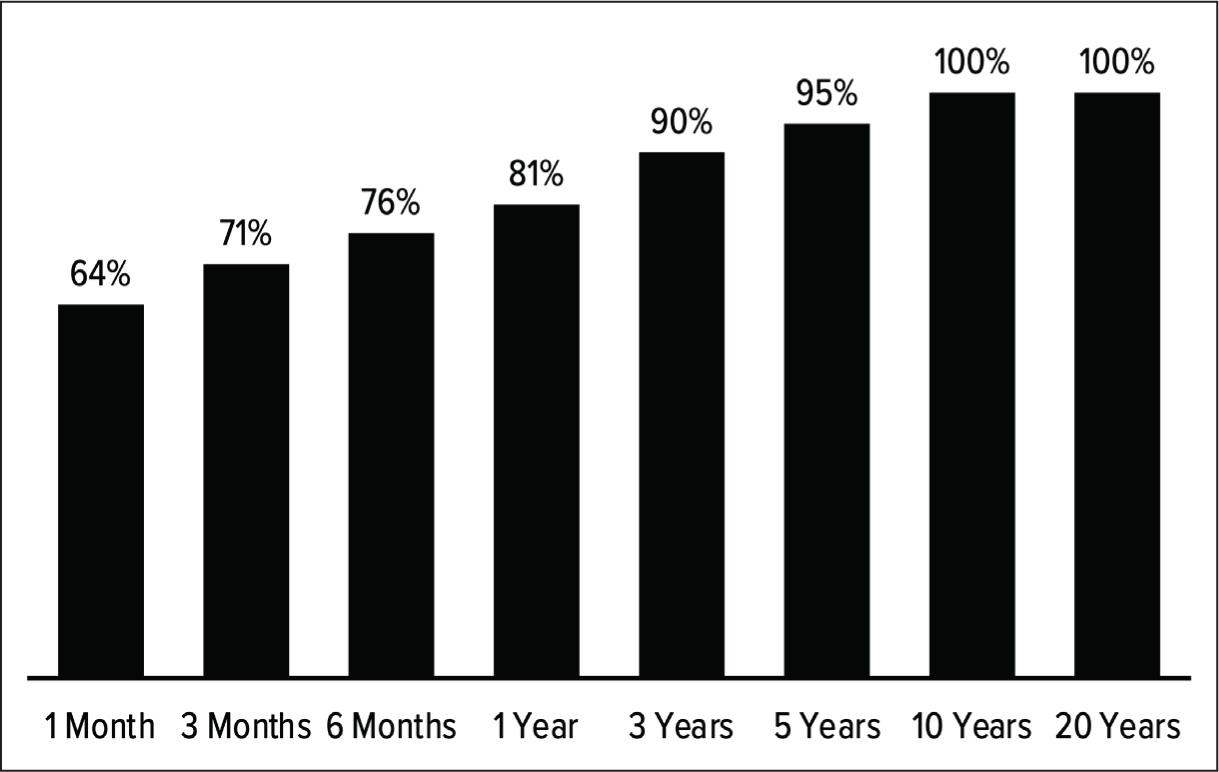
The data is clear – the longer your time horizon, the more likely you will experience positive results. Historically, if you held a 60/40 portfolio for one month, there is a 64% chance you would have had a positive return. If you held for 10 years, you were up 100% of the time.
Of course, a positive result doesn’t guarantee a specific level of return. Figure 1.3 shows the historical rolling 10-year total returns for a 60/40 portfolio.
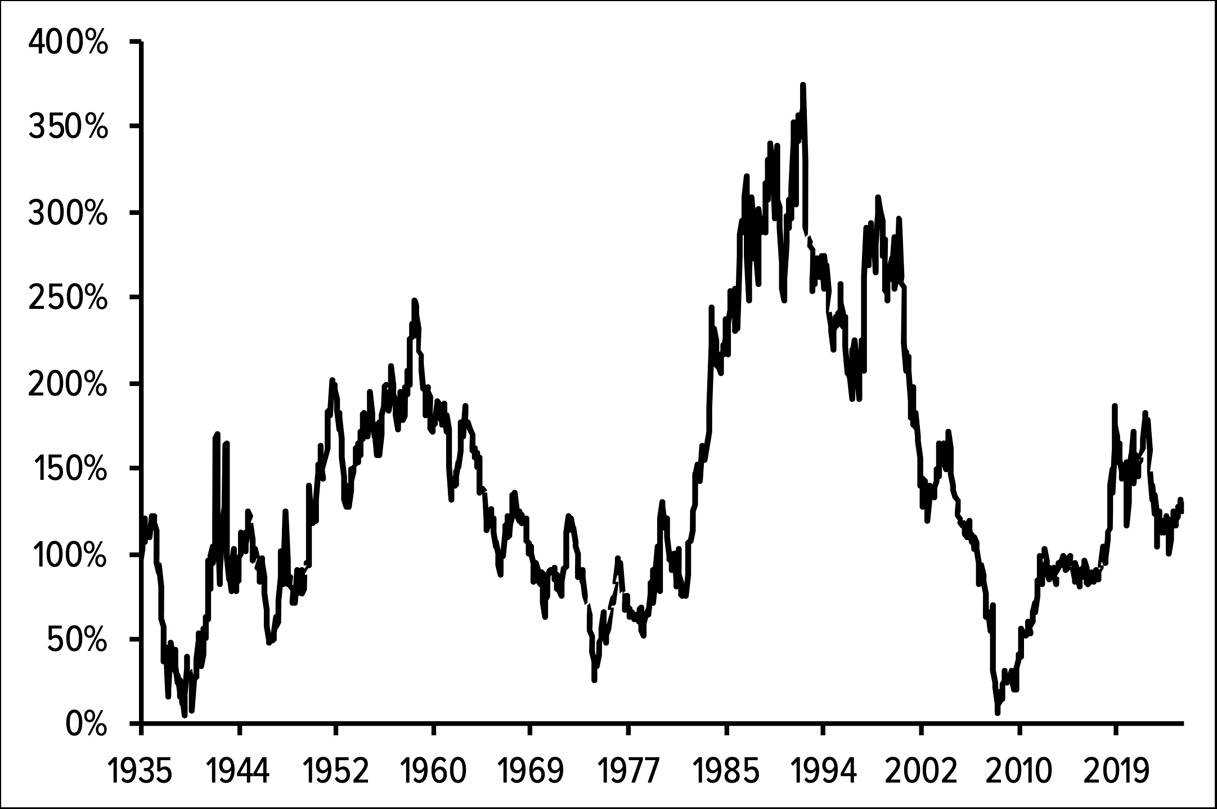
The returns tend to trend much lower during financial crisis periods in the 1930s, 1970s and 2000s. Some 10-year returns have been better than others, but the results have been impressive nonetheless.
Whether you have all of your money in stocks or a more diversified portfolio, long-term investing continues to give you the best odds of success in the markets.
Don’t fixate only on the shark attacks. This is easy to say if you’re reading this on a calm day in the markets when recent returns have been good. But remember it on the days, months and years when the market is falling too.