Risk and Reward
Chapter 10
The Stock Market vs. the Economy
ECONOMY
“An economist is an expert who will know tomorrow why the things he predicted yesterday didn’t happen
today.”
– LAURENCE J. PETER
THE WHOLE IDEA of “the economy” as we know it today is relatively new.
In fact, the concept of gross domestic product (GDP) as a way to measure economic growth wasn’t developed until the aftermath of the Great Depression.
Simon Kuznets, an economist who won the Nobel Prize for his work in this area, submitted a report to U.S. Congress in 1934 in which he used a concept called national income to track economic activity. GDP was born out of this idea, but it didn’t become the standard methodology used by countries around the globe until the end of the Second World War.
Once economists were able to measure economic output, they could calculate the damage previous downturns had caused to the economy. They calculated that in the 1800s there were 18 recessions in addition to six panics or depressions. The National Bureau of Economic Research (NBER), the organization responsible for officially declaring recessions, lists the longest GDP contraction on record at 65 months, from October 1873 to March 1879, in what is known as the Long Depression.*
After a land price boom-bust in the early 1800s, the word panic entered the lexicon to describe speculative economic episodes that resulted in a spectacular collapse. Panic was used for the remainder of the century to describe what is now termed a depression. Government officials decided they needed something less alarming to the public, which is how the term recession came to be used to describe economic downturns of varying severity.
From the start of the 1930s until halfway through the 2020s, the U.S. economy spent 185 months – 16% of the time – in the throes of recession. Alternatively, this means that 84% of the time the economy was not in a recession and was thus in an expansion or treading water.
My general investing philosophy is that the stock market usually goes up, but sometimes it goes down. You can make a similar claim about the U.S. economy. Most of the time the economy is growing, but sometimes it shrinks.
For both the economy and the stock market, it is foolish to assume the good times will last forever. The good times are usually followed by bad times.
The hard part about financial markets and the economy is that it’s nearly impossible to predict when and how badly things will end. Or if they will end at all. . .
Predicting recessions is hard
The 2020s experienced one of the biggest economic shocks in history. When the pandemic struck in early 2020, we essentially turned off the economy and then turned it back on again like a Nintendo. Millions of people began working from home with no advance notice. Businesses shut down. Oil prices went negative. Millions of people lost their jobs. Figure 10.1 shows how the unemployment rate spiked from 3.5% to a historically high level of 14.7% within the space of two months in early 2020.
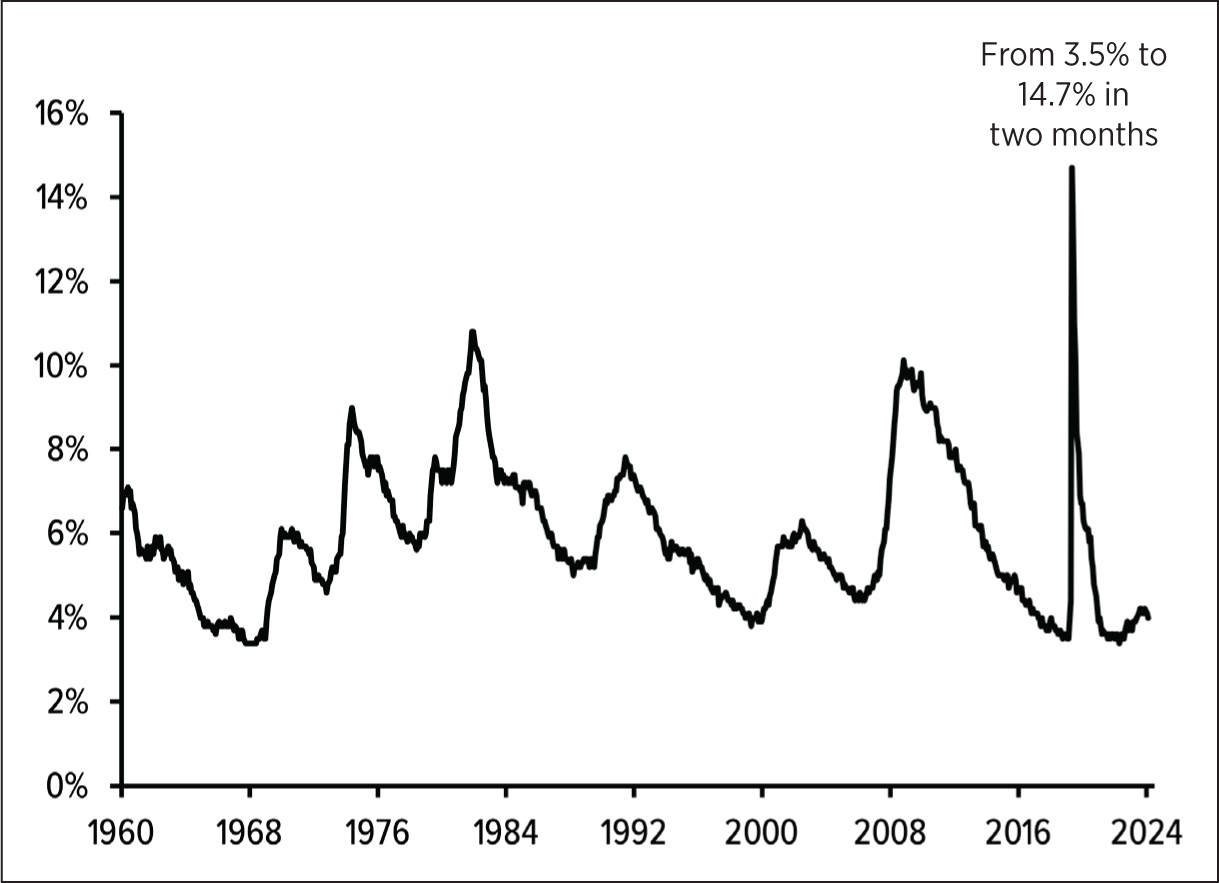
The Covid-induced recession of early 2020 will go down as one of the most unusual economic contractions in history. Lasting just two months, it saw the steepest quarterly GDP decline since the Great Depression. NBER didn’t acknowledge the start of the February 2020 downturn until June of that year. Frankly, we didn’t need official confirmation to know a recession had hit. The moment the NBA postponed its season, Tom Hanks announced he had contracted Covid, and schools nationwide shut down, it was clear a recession was right on our doorstep.
It’s not always that easy. That period of uncertainty was followed by unprecedented levels of spending from governments around the globe, supply chain shocks, and a war in Ukraine which led to the highest level of inflation in four decades.
By 2022, a recession was not just consensus – it felt obvious. It wasn’t just economic models sounding the alarm. Everyone from economists to investors and pundits alike assumed it was only a matter of time before the economy slowed considerably. Prominent figures like Amazon’s Jeff Bezos, JP Morgan’s Jamie Dimon, and the Bond King Jeffrey Gundlach all warned of an impending recession. In fact, Bloomberg ran a headline in October 2022 that read:
Forecast For U.S. Recession Within Year Hits 100%
The recession never materialized and the economy kept growing.
How can that be? From 100% likelihood – certainty! – to not happening at all.
There are many reasons GDP kept growing, but the key takeaway is that predicting the economy’s next move is a fool’s errand. Even when a recession does occur, forecasting its timing and severity can be incredibly challenging.
For starters, the definition of a recession itself is difficult to pin down. Some people claim it’s two consecutive negative quarterly GDP prints. NBER has its own definition:
The NBER’s traditional definition of a recession is that it is a significant decline in economic activity that is spread across the economy and that lasts more than a few months. The committee’s view is that while each of the three criteria – depth, diffusion, and duration – needs to be met individually to some degree, extreme conditions revealed by one criterion may partially offset weaker indications from another.
That is a lot of jargon to say, “It’s complicated,” which makes sense when talking about something as big, diverse and dynamic as the U.S. economy. There are billions of moving pieces. Plus, economic data is not always current like stock prices. Economic data requires estimates, surveys, updates and adjustments. With so many moving parts in the multi-trillion-dollar U.S. economy, it can be challenging to fully grasp what’s happening in real time.
For example, a brief recession began in January 1980, but NBER didn’t officially confirm its start until June, just one month before it ended. By the time they declared the recession had finished in July 1980, a new economic contraction had already begun in July 1981. The recession from July 1981 to November 1982 wasn’t officially recognized until July of 1983. Similarly, the recession that started in the summer of 1990 wasn’t officially acknowledged until the spring of 1991. NBER didn’t declare the March 2001 recession until November 2001 – the same month it ended. The Great Financial Crisis, which began in December 2007, wasn’t officially designated until December 2008, the same month Bernie Madoff’s Ponzi scheme was exposed.
If the literal judges of what constitutes a recession can’t tell when it’s happening, what chance do you and I have?
Waiting for the dust to settle
Imagine I could provide you with the exact start and end dates of economic slowdowns before they occur. Would you be able to use this knowledge to earn better returns in the stock market?
Probably not. Stock market returns before, during and after recessions are all over the place. It’s not as simple as getting out before the recession, then back in when the recession is over.
Table 10.1 provides a look at every recession since the Second World War along with S&P 500 returns in the six months leading up to the recession, during the actual recession itself and then one, three, five and 10 years from the end of the recession.
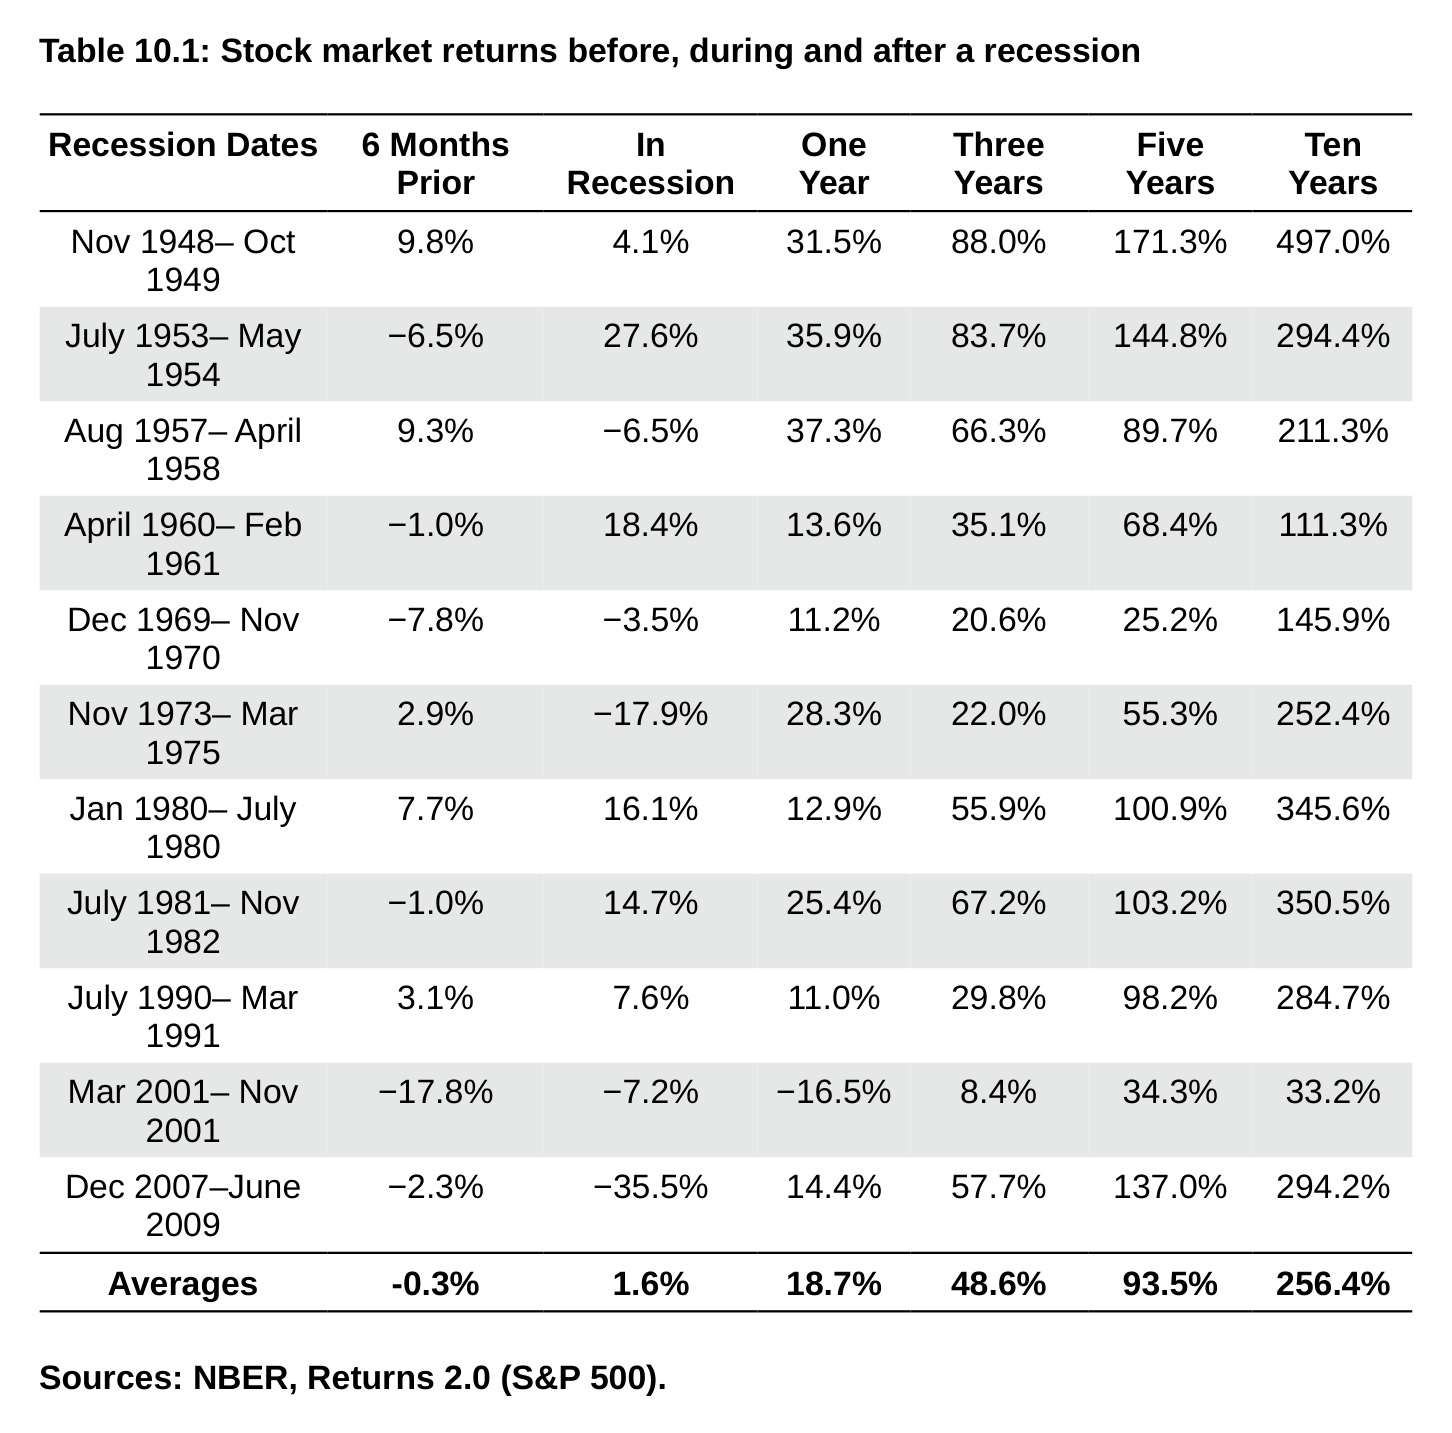
Table 10.1: Stock market returns before, during and after a recession Recession Dates 6 Months In Recession One Year Three Years Five Years Ten Years Prior Nov 1948– Oct 9.8% 4.1% 31.5% 88.0% 171.3% 497.0% 1949 July 1953– May −6.5% 27.6% 35.9% 83.7% 144.8% 294.4% 1954 Aug 1957– April 9.3% −6.5% 37.3% 66.3% 89.7% 211.3% 1958 April 1960– Feb −1.0% 18.4% 13.6% 35.1% 68.4% 111.3% 1961 Dec 1969– Nov −7.8% −3.5% 11.2% 20.6% 25.2% 145.9% 1970 Nov 1973– Mar 2.9% −17.9% 28.3% 22.0% 55.3% 252.4% 1975 Jan 1980– July 7.7% 16.1% 12.9% 55.9% 100.9% 345.6% 1980 July 1981– Nov −1.0% 14.7% 25.4% 67.2% 103.2% 350.5% 1982 July 1990– Mar 3.1% 7.6% 11.0% 29.8% 98.2% 284.7% 1991 Mar 2001– Nov −17.8% −7.2% −16.5% 8.4% 34.3% 33.2% 2001 Dec 2007–June −2.3% −35.5% 14.4% 57.7% 137.0% 294.2% 2009 Averages -0.3% 1.6% 18.7% 48.6% 93.5% 256.4% Sources: NBER, Returns 2.0 (S&P 500).
It’s often said that the stock market is forward-looking, but that doesn’t mean it’s all knowing. In nearly half of these recessions, the stock market was up in the six months before the downturn hit. And 55% of the time the stock market rose during the actual recession itself! The biggest takeaway from this data is how wonderful the returns are coming out of an economic contraction. The three, five, and 10-year returns following an economic reset provide ample evidence that you should not get scared out of stocks just because the economy slows. Recessions are a wonderful buying opportunity.
The stock market and the economy aren’t always in sync with one
another. At times, the stock market front runs the economy, while other times it’s slow to react to economic data. Occasionally, stocks decline as the economy contracts, and at other times they hit bottom well before the economy does.
Recessions are painful, so it’s understandable that people want to time the market when a slowdown feels imminent. The problem here is twofold:
1. Predicting the timing of a recession is hard to do. 2. Predicting how and when the stock market will react to a recession is also
difficult.
You could nail the timing of the recession, but whiff on the bottom of the stock market. In the eight recessions that occurred between 1950 and 2010, six of them saw the stock market bottom before the recession was over. In those instances, the stock market bottomed four to five months before the recession ended. The stock market bottoms an average of nine months before the nadir in corporate earnings in a bear market. If you wait for the dust to settle on the economy, there’s a good chance the stock market will leave you behind.
The Great Financial Crisis recession technically ended in June 2009. However, the stock market bottomed in early March 2009. By the time the economy bottomed, the stock market was already up almost 40%. The S&P 500 had already zoomed nearly 60% higher by the time the unemployment rate peaked at around 10% in October 2009 and finally began its descent.
To quote Warren Buffett: “If you knew what was going to happen in the economy, you still wouldn’t necessarily know what was going to happen in the stock market.”
Timing the economy is hard. Timing the stock market is harder.
The stock market vs. the economy
The stock market is mostly made up of large corporations that make things and sell things. The economy is mostly the stuff we do with those things. Most of the time the stock market and the economy are moving in the same direction, but they can and will diverge. Sometimes investors pay a high multiple of corporate profits when buying stocks and sometimes they pay a
low multiple. Sometimes high economic growth leads to high stock market returns, but this relationship is not set in stone.
Take a look at the inflation-adjusted annual returns for the U.S. stock market compared to real GDP growth by decade in Table 10.2.
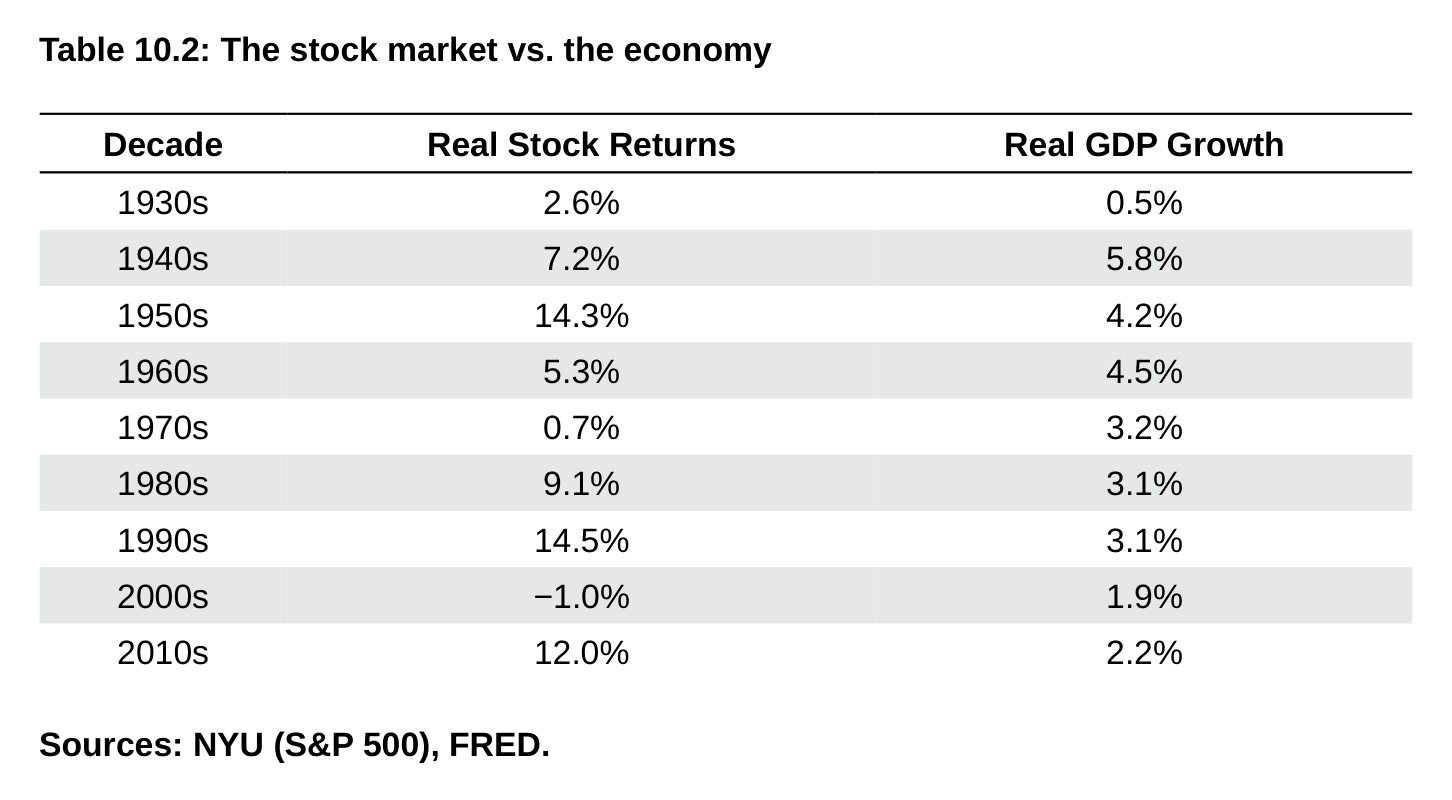
Table 10.2: The stock market vs. the economy Decade Real Stock Returns Real GDP Growth 1930s 2.6% 0.5% 1940s 7.2% 5.8% 1950s 14.3% 4.2% 1960s 5.3% 4.5% 1970s 0.7% 3.2% 1980s 9.1% 3.1% 1990s 14.5% 3.1% 2000s −1.0% 1.9% 2010s 12.0% 2.2% Sources: NYU (S&P 500), FRED.
You can see that economic growth in the 1940s was higher than it was in the 1950s, but stock market returns were much better in the 1950s than the prior decade. Real GDP growth was basically the same rate in the 1970s, 1980s and 1990s. Yet the stock market performed terribly in the 1970s and went bananas in the 1980s and 1990s. Growth was subdued in each of the first two decades of the 21st century. One of those decades experienced phenomenal stock market performance while the other was dreadful.
The stock market is far more volatile than the economy, as well. Table 10.3 shows the rankings of the worst stock market drawdowns and GDP contractions in the United States since 1950.
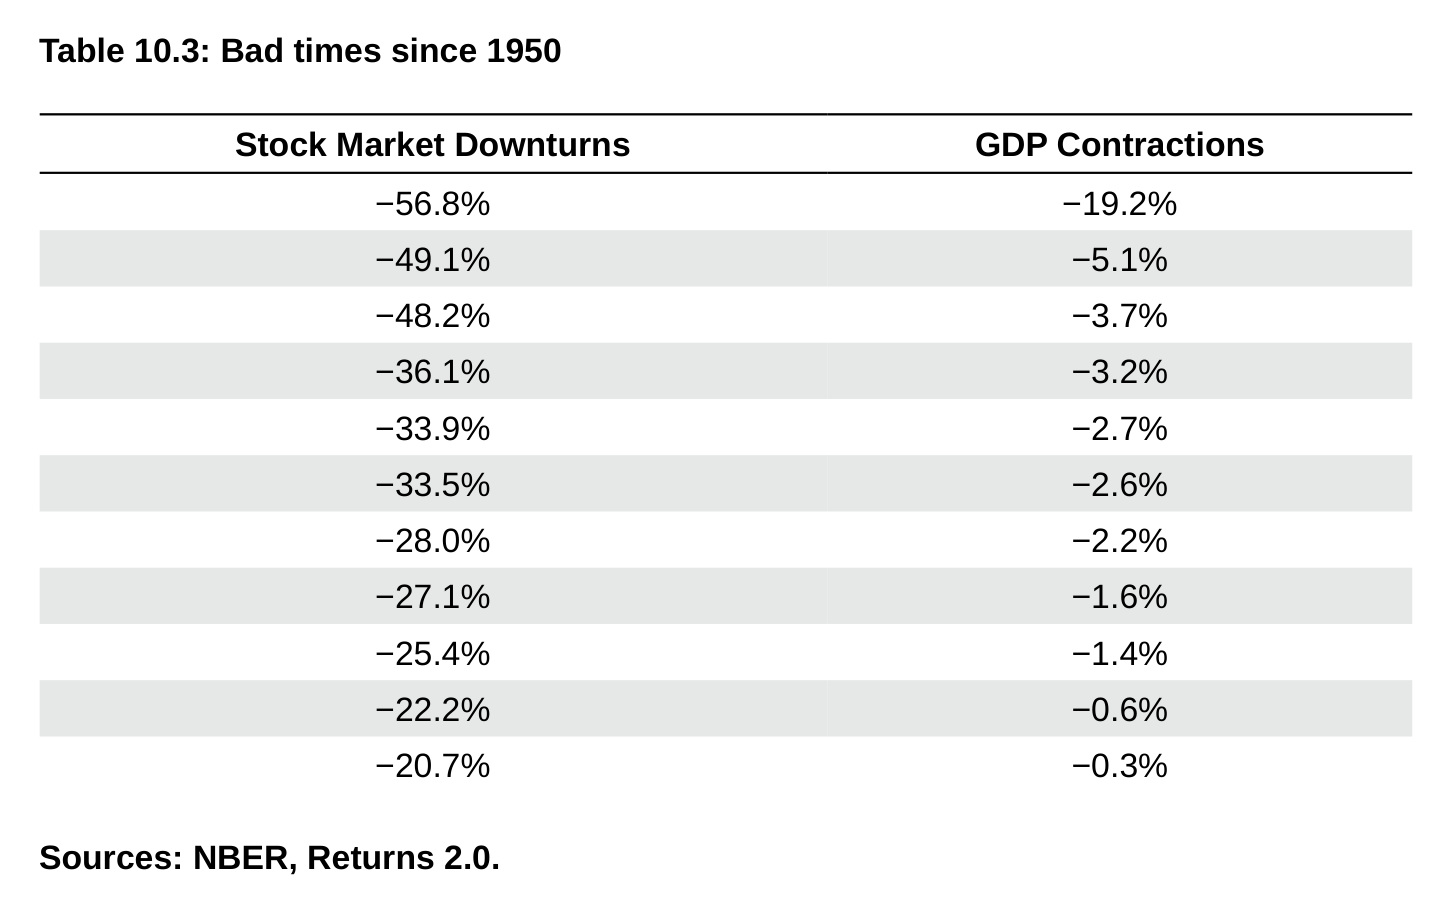
Table 10.3: Bad times since 1950 Stock Market Downturns GDP Contractions −56.8% −19.2% −49.1% −5.1% −48.2% −3.7% −36.1% −3.2% −33.9% −2.7% −33.5% −2.6% −28.0% −2.2% −27.1% −1.6% −25.4% −1.4% −22.2% −0.6% −20.7% −0.3% Sources: NBER, Returns 2.0.
The drawdowns in the stock market are magnitudes bigger than contractions in the economy. The worst reduction in GDP is a run-of-the-mill bear market in stocks. To be fair, the stock market is a value at a point in time while the economy is how much value is produced over a period of time. Still, it’s important to remember the stock market likes to freak out far more drastically than the economy.
Why does the stock market have bigger swings than the economy? Legendary investor Howard Marks once wrote it’s, “[b]ecause of the importance and unpredictability of market participants’ psyches or emotions. Investor sentiment swings a great deal, swamping the short-run influence of fundamentals. It’s for this reason that relatively few market forecasts prove correct, and fewer still are ‘right for the right reason.’”
In other words, the stock market is volatile because people’s emotions, reactions and predictions are volatile.
In the early 1980s, Professor Robert Shiller set out to answer the question: Do stock prices move too much to be justified by subsequent changes in dividends? Shiller wanted to figure out how well the stock market tracks the present value of future cash flows in the short term. In the land of textbooks, the present value of any financial asset should equate to its discounted future cash flows. If only it were that easy.
Shiller concluded that, no, stock prices do not neatly track fundamentals. In fact, the dividend stream of the stock market is not all that volatile. Cash flows don’t increase or decrease nearly as much as stock prices do. Shiller noted that between September 1929 and June 1932, the inflation-adjusted S&P index fell 81%. Real dividends fell just 11% in that time. Between January 1973 and December 1974, the real S&P index was down 54%, while real dividends declined just 6%. The difference is investor emotions which go into hyperdrive during the bad times.
I have a confession to make. The title of this chapter is somewhat misleading; the stock market and the economy are not always opposed. Sometimes the stock market is the economy. But other times it’s not. The stock market and the economy share a complex, often unpredictable relationship. While they move together over the long run, their short-term paths are shaped by countless factors – some rational, others entirely emotional. Markets swing wildly because investor sentiment swings wildly. The economy grows steadily over time, but recessions are inevitable.
I’m not trying to tell you that recessions don’t matter or that stock market volatility can be completely ignored. When these things happen it can be painful. It’s just that trying to guess them in advance is a losing proposition. The lovely thing about the stock market is that it allows you to ride the coattails of corporations by taking part in their profits, growth and ingenuity as they innovate and create shareholder value.