Risk and Reward
Chapter 9
The Two Types of Bear Markets
MARKETS
“If you spend 13 minutes a year trying to predict the
economy, you have wasted 10 minutes.”
– PETER LYNCH
WALL STREET PEOPLE love jargon. It gives them an air of superiority and
intelligence. If you look and sound the part in the world of finance, people tend to trust you. Words like robust, granular, idiosyncratic, constructive and proprietary create a sense of importance. Finance people also love using animals when it comes to their words and phrases.
Bulls make money. Bears make money. Pigs get slaughtered. That investment is a dog. Dead cat bounce (more on that shortly). Hawks, doves, butterfly spreads, iron condors, black swan events, turtle traders and more.
There are various theories about where the terms bull market and bear market came from. Some say an uptrend is called a bull market because bulls bring their horns up when they gore you. A downtrend is called a bear market because bears swipe down with their claws. There are other explanations, but this one makes sense intuitively.
Bull markets are more exciting because that’s when you make money, but bear markets play the more crucial role in your long-term investment success. Surviving downturns is essential to ensure you’re around to benefit from the next uptrend. There is no sunshine without nightfall, after all.
I want to look at two main types of bear markets in this chapter:
1. Recessionary bear markets. Market downturns that occur because of an
economic slowdown. 2. Non-recessionary bear markets. Market downturns that occur for some
other reason beyond a recession.
The difference between the two is essentially the mama bear (recessionary) versus the baby bear (non-recessionary). The mama bears tend to be bigger and badder, while the baby bears can cause some damage, sure, but the scars are typically not as deep or long-lasting.
First up, Table 9.1 shows a list of recessionary bear markets going all the way back to the Great Depression, where a bear market is defined as a peak-to-trough drawdown of 20% or worse.*
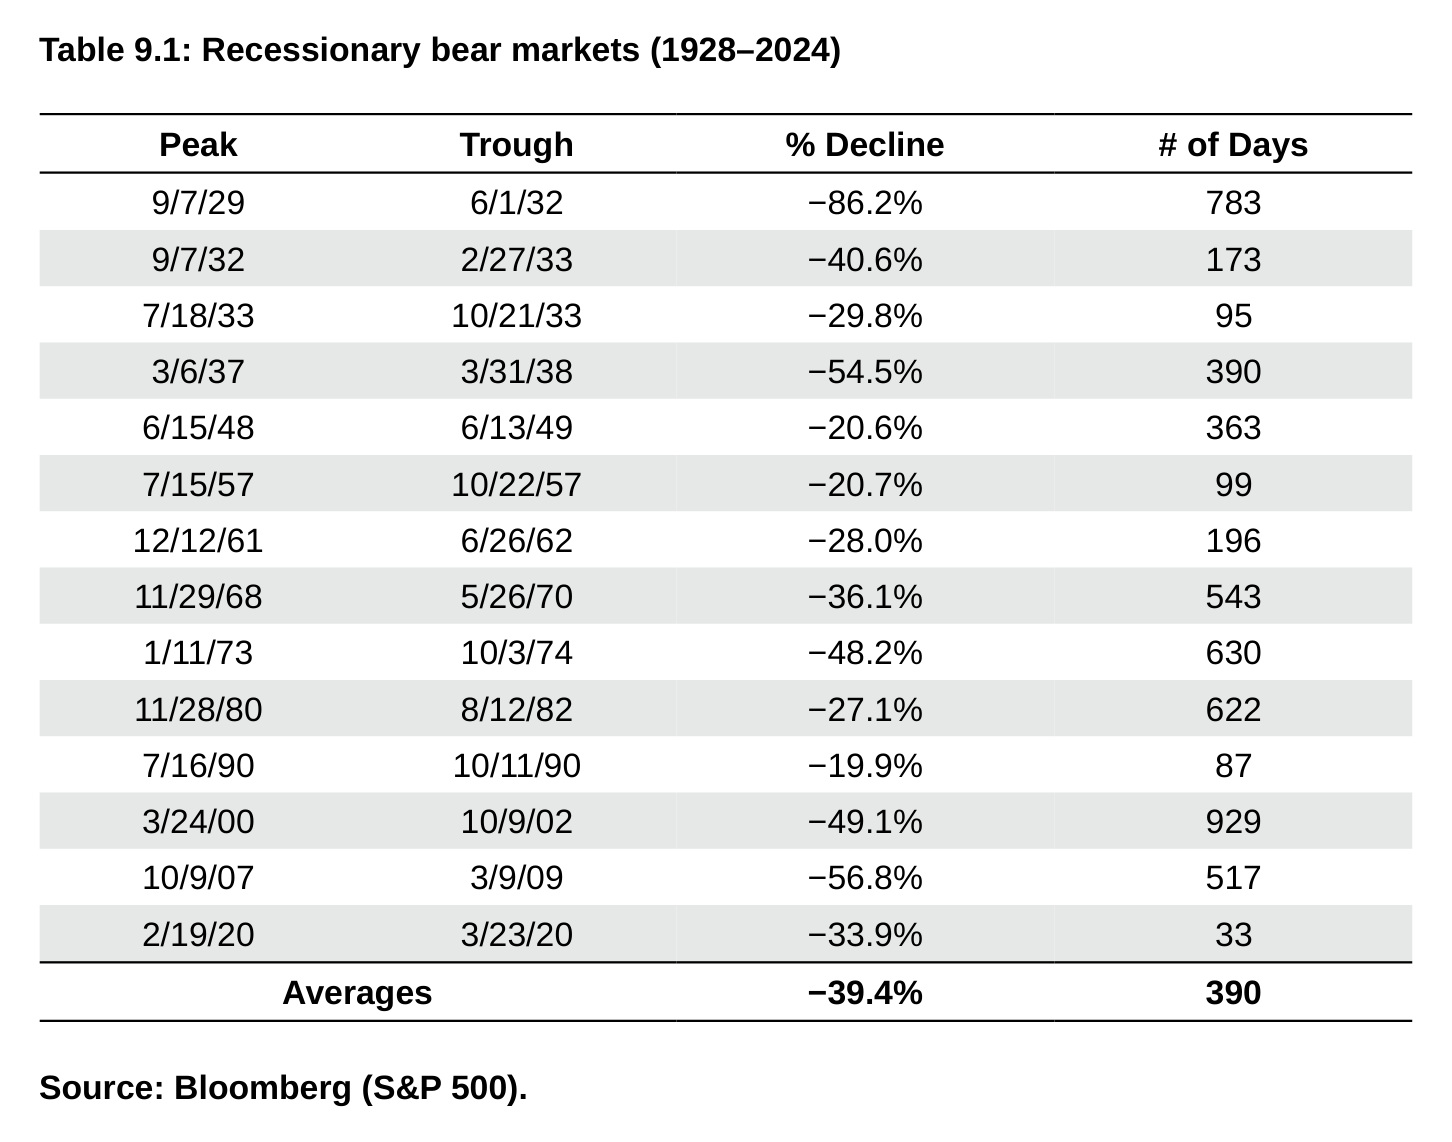
Table 9.1: Recessionary bear markets (1928–2024) Peak Trough % Decline # of Days 9/7/29 6/1/32 −86.2% 783 9/7/32 2/27/33 −40.6% 173 7/18/33 10/21/33 −29.8% 95 3/6/37 3/31/38 −54.5% 390 6/15/48 6/13/49 −20.6% 363 7/15/57 10/22/57 −20.7% 99 12/12/61 6/26/62 −28.0% 196 11/29/68 5/26/70 −36.1% 543 1/11/73 10/3/74 −48.2% 630 11/28/80 8/12/82 −27.1% 622 7/16/90 10/11/90 −19.9% 87 3/24/00 10/9/02 −49.1% 929 10/9/07 3/9/09 −56.8% 517 2/19/20 3/23/20 −33.9% 33 Averages −39.4% 390 Source: Bloomberg (S&P 500).
Not all of these drawdowns were the end of the world, but this list contains a who’s-who of the worst crashes in history – Great Depression,
1937 crash, 1973 to 1974 bear market, bursting of the dot-com bubble, Great Financial Crisis and Covid crash.
This makes sense when you consider people lose their jobs during a recession. Companies go out of business. People lose money and stop spending as much. Profits slow and businesses contract. It doesn’t take a genius to figure out why the stock market tends to fall precipitously during a collapse in economic activity.*
The average recessionary bear market resulted in a loss of almost 40% and lasted well over a year (as shown in the bottom row of Table 9.1). Imagine you have a $1 million stock portfolio that falls to $600,000. Seeing your money essentially evaporate like that is painful.
Next, let’s look at the non-recessionary bear markets. Table 9.2 shows that plenty of bear markets have occurred outside of a recession. There have been 11 non-recessionary bear markets since 1928.*
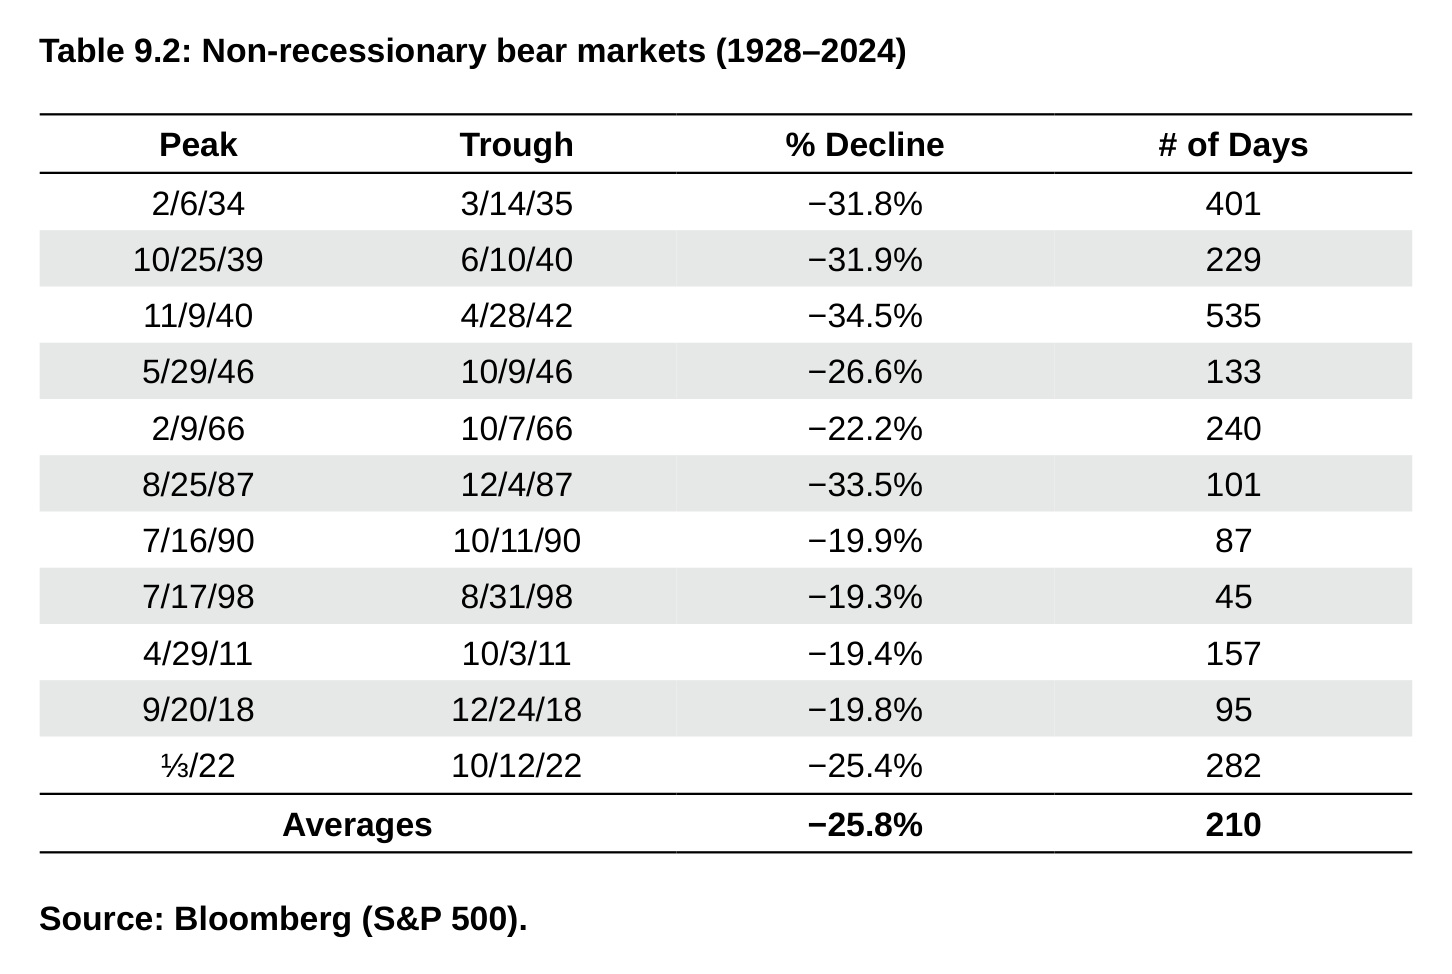
Table 9.2: Non-recessionary bear markets (1928–2024) Peak Trough % Decline # of Days 2/6/34 3/14/35 −31.8% 401 10/25/39 6/10/40 −31.9% 229 11/9/40 4/28/42 −34.5% 535 5/29/46 10/9/46 −26.6% 133 2/9/66 10/7/66 −22.2% 240 8/25/87 12/4/87 −33.5% 101 7/16/90 10/11/90 −19.9% 87 7/17/98 8/31/98 −19.3% 45 4/29/11 10/3/11 −19.4% 157 9/20/18 12/24/18 −19.8% 95 ⅓/22 10/12/22 −25.4% 282 Averages −25.8% 210 Source: Bloomberg (S&P 500).
The average peak-to-trough drawdown was around 26%, lasting for roughly seven months (210 days) before bottoming.
Comparing the data on the two types of bear markets, you can see that
bear markets outside of a recession tend to be shallower and less lengthy, while recessionary bears are greater in magnitude and duration. Table 9.3 provides the tale of the tape comparing the two types of bear markets going back to the late 1920s.
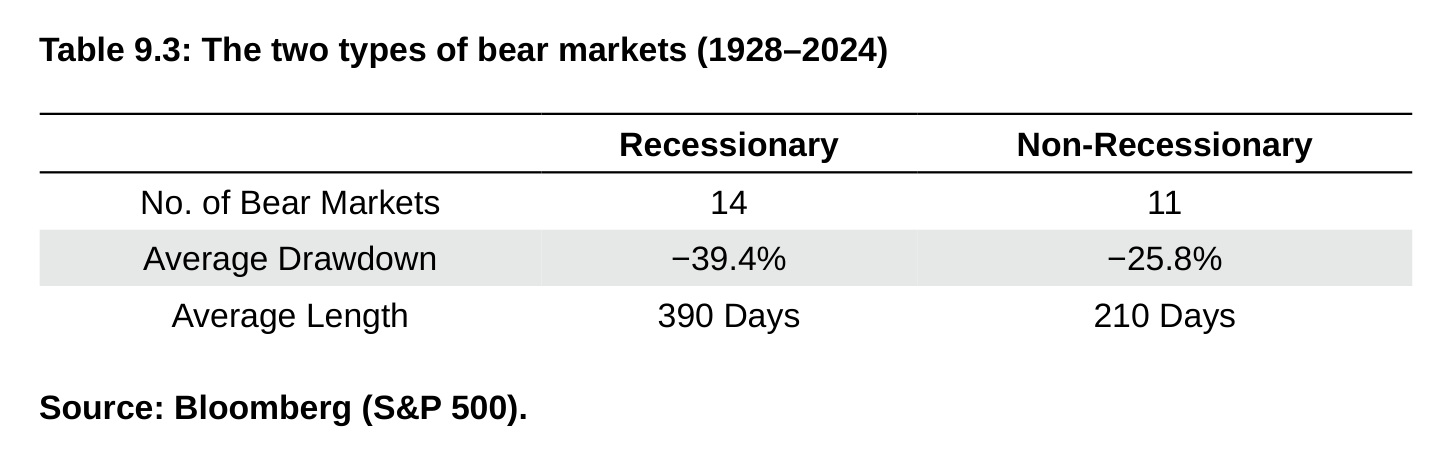
Table 9.3: The two types of bear markets (1928–2024) Recessionary Non-Recessionary No. of Bear Markets 14 11 Average Drawdown −39.4% −25.8% Average Length 390 Days 210 Days Source: Bloomberg (S&P 500).
There have been 25 bear markets over the past 100 years, meaning they happen once every four years or so, on average. The hard part is you can’t set your watch to this schedule, because there are times when bear markets cluster close together and other times when they don’t happen nearly as often. For example, following the 1973 to 1974 massacre, there wasn’t another bear market until 1982. After the shallow bear market in 1990, there wasn’t another big decline until 1998. On the other hand, the 1930s were littered with bear markets and crashes. There were six bears in total in that decade. There were also four separate bear markets in the 1940s.
These crashes look easy to navigate with the benefit of hindsight because you know when they ended. But living through them is another story. It always feels like it’s too soon to buy but too late to sell because of the dreaded dead cat bounce.
The dead cat bounce
There’s an old saying that the stock market takes the stairs up but the elevator down. And while it’s true that stocks tend to fall much faster than they rise, the pattern of volatility during a downturn can play head games with you. Jerry Seinfeld once joked, “Breaking up is like pushing over a Coke machine. You can’t do it in one push. You gotta rock it back and forth a few times and then it goes over.”
That’s a good analogy for many stock market crashes too. History’s great
crashes are full of head-fake rallies that offered investors a false sense of hope that proved to be fleeting.
During the stock market crash that triggered the Great Depression, there was an impressive 47% rally from late 1929 to early spring 1930, following the initial plunge. Prior to that rally, stocks had already dropped 45%. The 1929–32 crash was marked by extreme volatility, including monthly gains of 8%, 9%, 12%, and 14%, as well as brief rallies of 23%, 27%, and 35% at various stages. With each rebound, investors hoped the worst was over, only to face yet another downward spiral. The stock market can be a cruel mistress indeed.
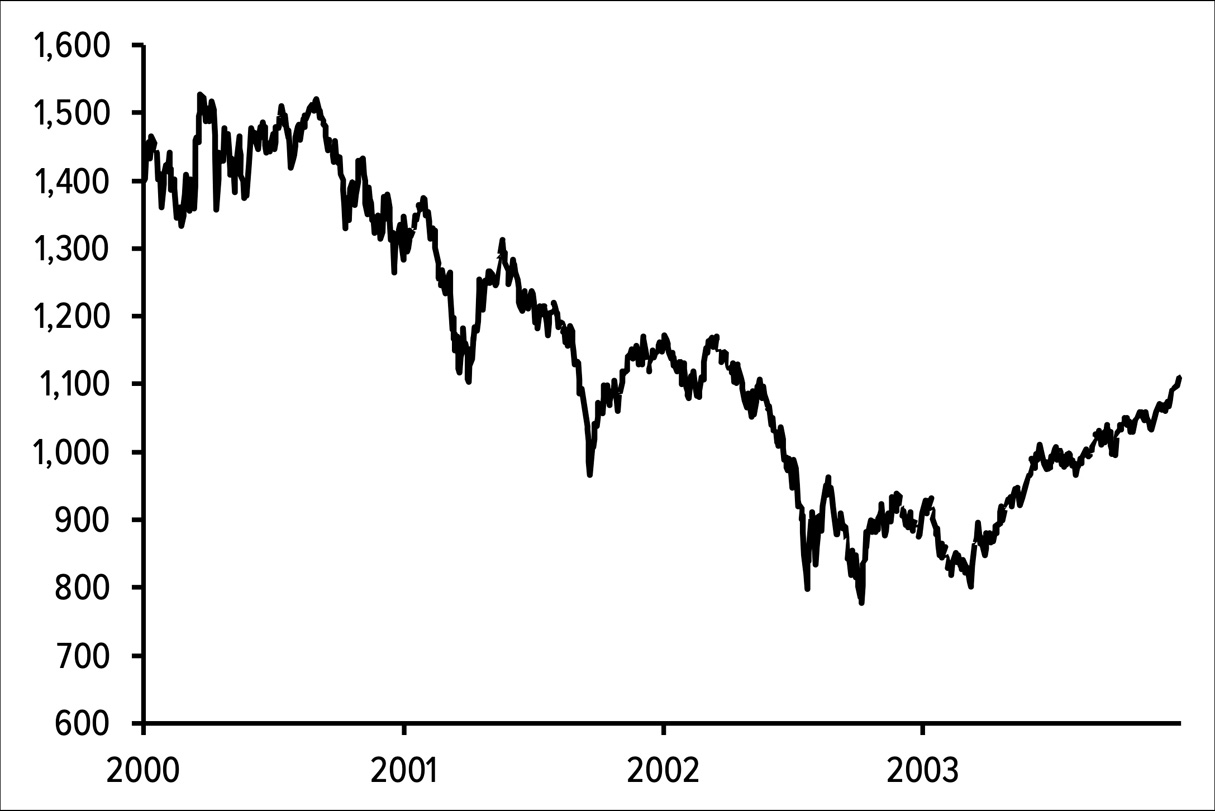
The bear market from 2000 to 2002 experienced four separate rallies of around 20% before ultimately bottoming out more than 50% below its peak. Even after hitting the lowest point, and seeing a quick 20% recovery, the market endured another 15% decline before finally beginning a sustained upward trend.
On a spreadsheet, market crashes may appear as though they move in a straight line downward, but in reality, they are usually far more erratic. Figure 9.1 shows the various rallies that occurred during the 2000 to 2002 crash.
There’s a good reason why it’s so difficult to tell the difference between a dead cat bounce within the context of a bear market from an actual bottom. When stocks eventually bottom, they do tend to see strong gains coming out of the gate. Coming out of a bear market it’s off to the races, which feels exactly the same as a dead cat bounce when you’re living through it!
Table 9.4 shows the returns three and six months out from S&P 500 bear market bottoms since 1950.
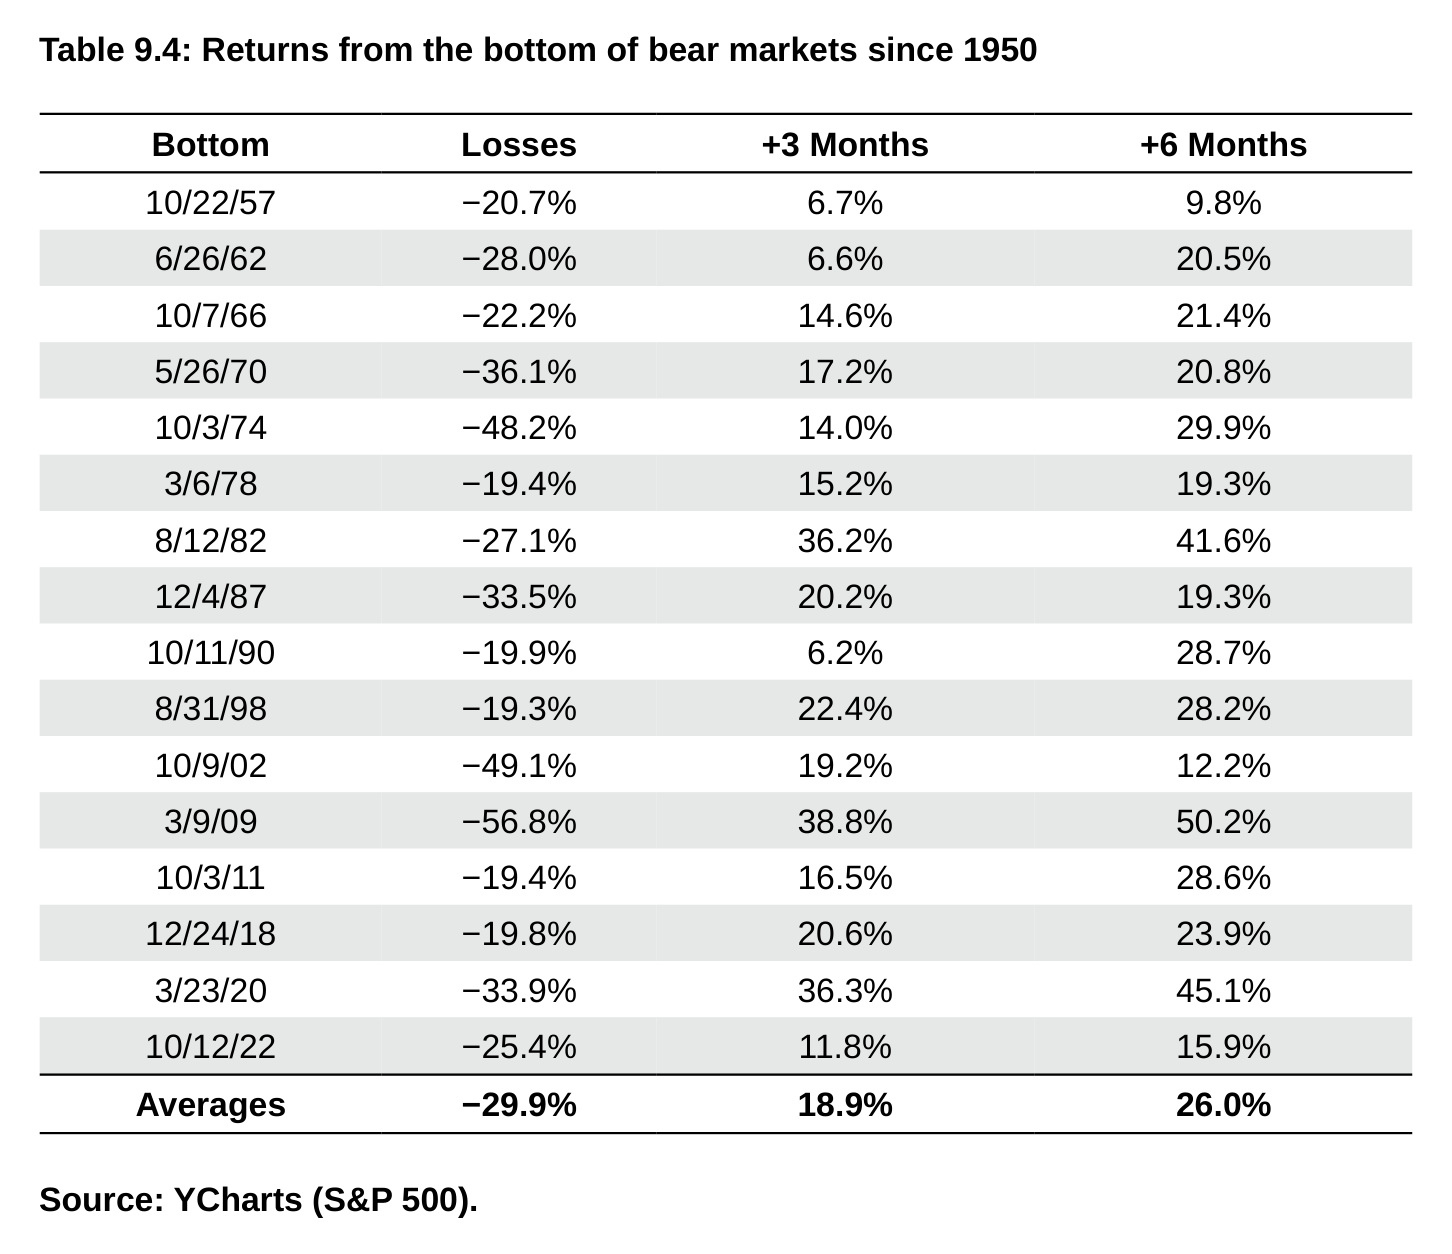
Table 9.4: Returns from the bottom of bear markets since 1950 Bottom Losses +3 Months +6 Months 10/22/57 −20.7% 6.7% 9.8% 6/26/62 −28.0% 6.6% 20.5% 10/7/66 −22.2% 14.6% 21.4% 5/26/70 −36.1% 17.2% 20.8% 10/3/74 −48.2% 14.0% 29.9% 3/6/78 −19.4% 15.2% 19.3% 8/12/82 −27.1% 36.2% 41.6% 12/4/87 −33.5% 20.2% 19.3% 10/11/90 −19.9% 6.2% 28.7% 8/31/98 −19.3% 22.4% 28.2% 10/9/02 −49.1% 19.2% 12.2% 3/9/09 −56.8% 38.8% 50.2% 10/3/11 −19.4% 16.5% 28.6% 12/24/18 −19.8% 20.6% 23.9% 3/23/20 −33.9% 36.3% 45.1% 10/12/22 −25.4% 11.8% 15.9% Averages −29.9% 18.9% 26.0% Source: YCharts (S&P 500).
In 13 out of the 16 bear markets there was a double-digit return in the first three months from the bottom. All but one time saw double-digit growth six months out, while 11 times stocks were up 20% or more. I’m sure every one of these recoveries was called a dead cat bounce or bear market rally in the moment. Fool me once shame on you. Fool me twice shame on me.
Long bear markets can be psychologically challenging because they give you a glimmer of hope and then squash it. The stock market can move hard and fast in both a dead cat bounce and a bear market bottom. The true nature of these bounces will only be known in hindsight, which is one of the reasons timing the market is nearly impossible.
Volatility clusters
Stock market cycles are often driven by some combination of regret and herding. Research shows investors hold onto losing stocks too long in hopes they will come back to their original price while selling their winners too early. Investors also anchor to recent results, so initially markets underreact to news, events or data releases.
On the flip side, once things become more apparent, investors herd and overreact, causing an overshoot in either direction. Fear, greed, overconfidence and confirmation bias can lead investors to pile into winning areas of the market after they’ve risen or pile out after they’ve fallen.
These feelings get taken to another level when the market is going down and you’re losing money. Table 9.5 presents a list of the top 15 best and worst days for the U.S. stock market since 1928.
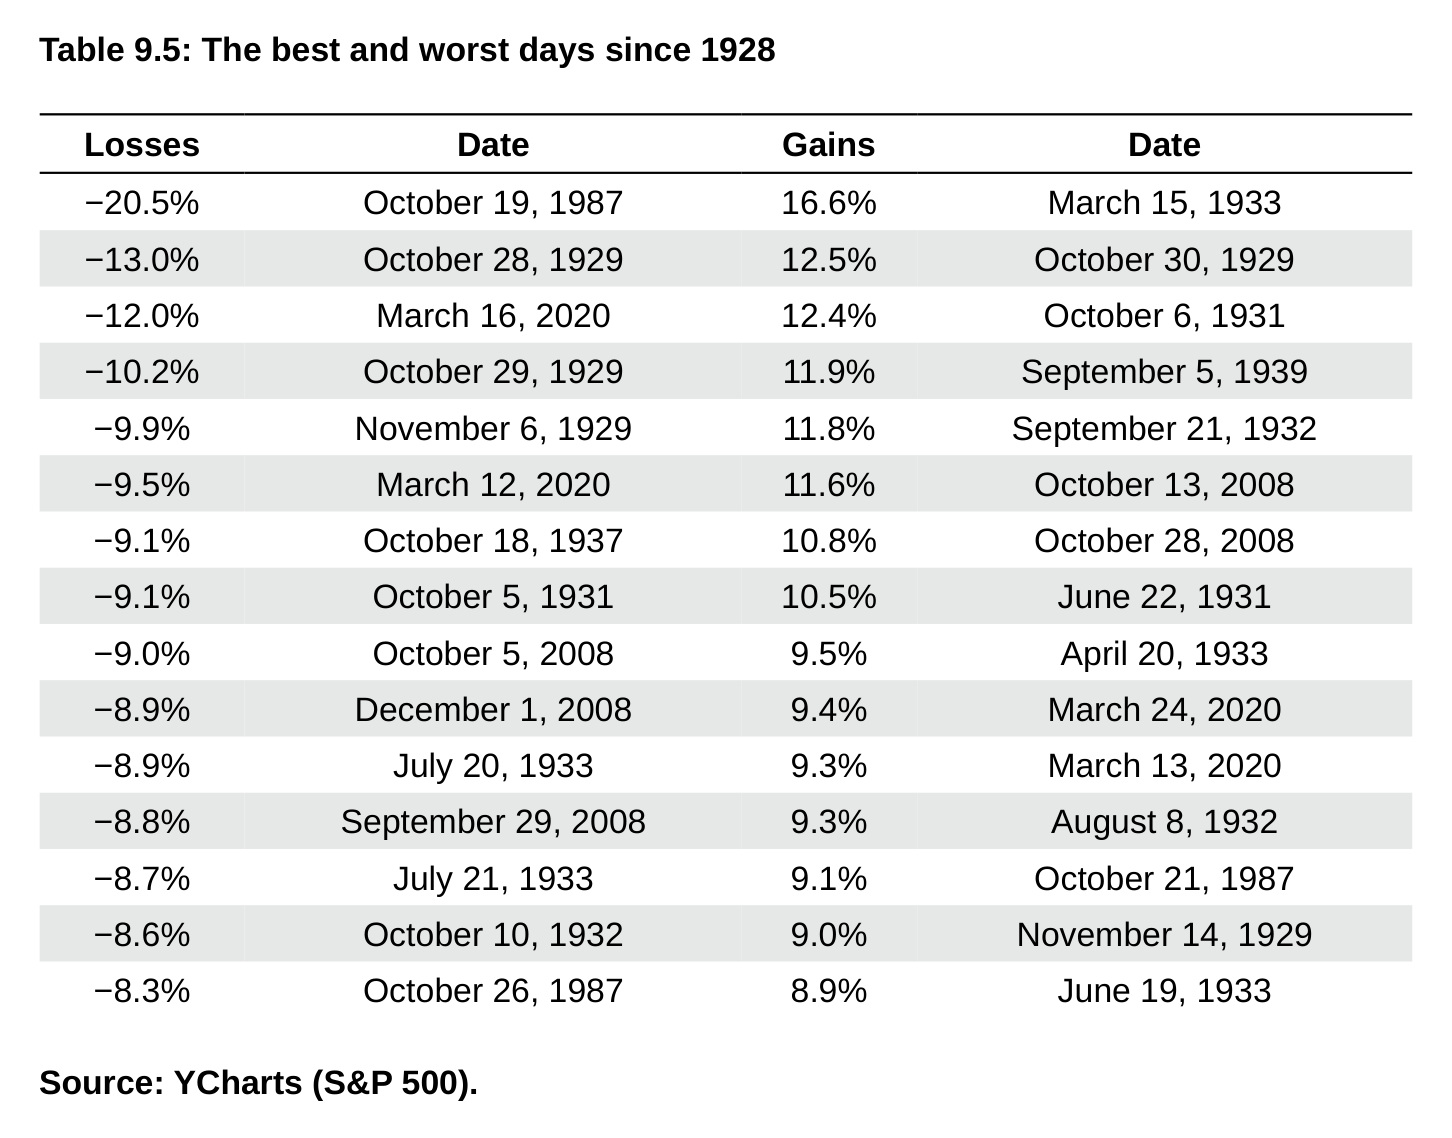
Table 9.5: The best and worst days since 1928 Losses Date Gains Date −20.5% October 19, 1987 16.6% March 15, 1933 −13.0% October 28, 1929 12.5% October 30, 1929 −12.0% March 16, 2020 12.4% October 6, 1931 −10.2% October 29, 1929 11.9% September 5, 1939 −9.9% November 6, 1929 11.8% September 21, 1932 −9.5% March 12, 2020 11.6% October 13, 2008 −9.1% October 18, 1937 10.8% October 28, 2008 −9.1% October 5, 1931 10.5% June 22, 1931 −9.0% October 5, 2008 9.5% April 20, 1933 −8.9% December 1, 2008 9.4% March 24, 2020 −8.9% July 20, 1933 9.3% March 13, 2020 −8.8% September 29, 2008 9.3% August 8, 1932 −8.7% July 21, 1933 9.1% October 21, 1987 −8.6% October 10, 1932 9.0% November 14, 1929 −8.3% October 26, 1987 8.9% June 19, 1933 Source: YCharts (S&P 500).
It’s no accident that some of the worst days in stock market history happened during major crashes. More than half of the worst days took place in and around the Great Depression, while three of the 15 biggest down days came in 2008. What is surprising is the fact that the best days in history also took place amid those very same downturns. Two-thirds of the best days occurred during the 1930s while two of the biggest up days were in the fall of 2008 as the financial system was crumbling. This is not a coincidence.
Bull markets tend to be relatively boring. It’s not giant leaps forward but more of a slow, methodical move higher. This is why there aren’t many headlines about bull markets unless the Dow crosses a nice round number. Progress takes time so the distribution of daily returns is relatively tight. Investors get lulled into a false sense of confidence.
Then bear markets come along, slap you in the face, pick you up off the ground, and then kick you in the shins for good measure. The biggest down days and up days typically occur during downtrends when investor emotions are heightened. In downward-trending markets, price movements are highly unpredictable, with wild swings in both directions. Panic selling and panic buying drive short-term volatility spikes both ways. The fear, anxiety, and panic that accompany these periods lead to overreactions, as the pain of losing money is so overwhelming.
Mr. Market
In his classic book The Intelligent Investor, Benjamin Graham describes short-term market fluctuations through a parable about an obliging business partner named Mr. Market. Each day, Mr. Market shows up to tell you what he thinks your investment is worth and offers to either buy your shares or sell you his stake in the company. Some days, Mr. Market is overly enthusiastic and offers you far more money than your shares are worth. Other days, Mr. Market is depressed and offers you substantially less than your shares are worth. Regardless, he shows up every day when the market is open to offer you a new price.
The good news is that you can choose when to engage with Mr. Market to buy or sell. If his offers aren’t appealing, you’re not obligated to accept them. Wise investors understand you should ignore Mr. Market on most occasions. In the short run, the stock market is a walking contradiction – cruel, heartless, and wildly unpredictable. Basing investment decisions on Mr. Market’s erratic mood swings is rarely a wise decision.
In his book Simple Wealth, Inevitable Wealth, Nick Murray compares the stock market to the planting of a tree. It takes time for trees to grow and take root. Trees require oxygen, water, sunlight and patience to reach their full potential. But you don’t dig up the tree to check its progress every few months. Murray explains, “Give the tree enough room, enough light, and enough time. Then leave it pretty much alone.” Successful investing requires a good deal of patience, discipline and letting your investments grow too.
In The Four Pillars of Investing, William Bernstein shares a metaphor from portfolio manager Ralph Wanger that brilliantly illustrates the stock market’s behavior. Wanger compares the stock market to a man walking his dog. While the man moves steadily toward his destination, the dog darts back and forth unpredictably on its leash. The dog’s movements are erratic and rapid, but the man maintains a slow, steady pace, always progressing in the right direction. In this analogy, the man represents the stock market in the long run, while the dog symbolizes its short-term volatility. Everyone pays attention to the dog while the owner’s path is the only one that matters.
The hard part is you don’t know when Mr. Market is going to change his mood. You don’t know when it’s time to prune some tree branches. You don’t know when the man will reach his destination or when the dog wants a breather in the shade. It takes an iron will to invest in the stock market because Mr. Market is a manic-depressive who wants you to chop down your tree too early and follow the dog instead of the man holding the leash.
Every time stocks drop a little, it feels like they could drop a lot more. When they enter a correction, it feels like a bear market could be next. And when they slip into a bear market, it feels like they will surely spiral into an all-out crash. In these market environments, you should go long humility and short hubris. The emotional pendulum of the stock market swings in both directions from fear to greed, panic to euphoria and back again. The problem is that it’s impossible to predict how far it will swing in either direction in advance.
How to prepare for a bear market
How you prepare for bear markets depends greatly on where you are in your investing lifecycle.
If you’re retired, nearing retirement or have a mature portfolio, you don’t always have the luxury of waiting out a prolonged bear market. Diversification and liquidity can help because you don’t have as much time to ride out a storm or as much income to buy more stocks at depressed prices. Cash and short-term bonds can act as a drag on long-term returns, but can ensure that you won’t be out of luck when you need to spend down your portfolio.
On the other hand, a bear market is a gift for younger investors who have decades ahead of them to save and invest. If you’ll be a net saver in the years ahead, stock market corrections and crashes are a buying opportunity. They allow you to buy stocks at discounted prices, lower valuations, and higher dividend yields. A long time horizon and consistent investing can help you tame even the most grizzly of bear markets. You just have to have the intestinal fortitude to keep buying stocks at the worst times.
Bear markets are a normal part of market cycles. The reasons vary, but the emotions are always the same. No one can predict how long they’ll last, but they do come to an end, and life goes on. You just need a solid handle on your risk profile and time horizon in the meantime.