Risk and Reward
Chapter 14
The First Rule of Compounding
COMPOUNDING
“The big money is not in the buying or the selling,
but in the waiting.”
– CHARLIE MUNGER
THERE’S AN ALLEGORY about a con artist who crafted high-end
chessboards for the rich.
His favorite mark was a wealthy king. The con artist had played chess against the king many times and could tell his majesty wasn’t very good with numbers. But none of the king’s underlings were brave enough to tell the boss he wasn’t good at math, so the ruler never realized his deficiency.
The swindler crafted a scheme to exploit the king’s vulnerability to his advantage. He meticulously created the most exquisite chessboard ever fashioned, each piece brimming with intricate details and unmatched artistry. When the king laid eyes on this masterpiece, he was thrilled. When asked how many gold coins or jewels it would cost, the con artist replied, “I don’t want your money. Just pay me in grains of rice.”
The king had plenty of rice throughout his lands, so he asked how much would be required.
“All I ask for is one grain of rice for the first square on the board, two for the second square, four for the third square, and so on. Just double the grains with each new square all the way up to the 64th space on the board.”
Apparently, none of the king’s staff had Microsoft Excel or a calculator, so no one bothered to do the math.
“I can handle a chessboard full of rice,” the king said as he agreed to the
deal.
The king told his servants to get the con artist his rice so he could enjoy his lovely new chessboard. Once they began to run the numbers, it was more challenging than initially thought. It only took until the 11th square to break 1,000 grains of rice. By the 21st square, the doubling of grains led to more than one million pieces of rice. In 20 more doubles from there they were up to one trillion grains. It would only get worse. The king couldn’t possibly produce that much rice – it didn’t exist. Of course, the con artist knew this and asked for gold or land in lieu of the rice.
Knowing he’d been duped, the king said he would be happy to pay up as soon as the con artist would individually count out the grains of rice he was owed.
Touche. As Kenny Rogers once said, “You’ve gotta know when to hold ’em, know when to fold ’em.” The con artist told the king to keep the chessboard as a gift and went on his merry way. You win some, you lose some.
Like the king, our brains are hardwired to think linearly, not exponentially. Unfortunately, in the real world, your returns from investing don’t happen as quickly as the grains of rice multiplying on that chessboard. It takes time, and it requires patience and discipline to see a payoff. But if you wait long enough that payoff can be spectacular. A good chunk of investing is putting your money to work in the stock market and then waiting. You just have to ensure you don’t screw things up along the way.
As Charlie Munger once said, “The first rule of compounding: Never interrupt it unnecessarily.”
The eighth wonder of the world
Compounding might be the eighth wonder of the world, but it takes time to morph from a caterpillar into a butterfly. From 1950 to 2024, the S&P 500 was up 11.5% per year. Let’s say you put $10,000 into the S&P at the outset of that 75-year period.
By 1960 your $10,000 would have grown to almost $60,000. By 1970 that $60,000 would double to more than $120,000, then $220,000 heading into the 1980s. Slow but steady growth. The original $10,000 would hit $1 million for the first time in 1989. Through the end of 2024, $10,000 invested in 1950 would have turned into $36 million! The snowball is tiny at first, but once it gets rolling the growth in undeniable.
The same is true when you average into the market over time. Let’s assume you invest $10,000 at the start of every year for 30 years and earn 10% on your money. By the end of 30 years, you would have saved a grand total of $300,000, which would have grown to just shy of $1.7 million. Not bad. However, because of the way compounding works, the majority of the growth is back-loaded. In this simple example, your investment gains would take 14 years to outpace the amount you saved each year. Saving matters more than investing when you’re just starting out. The total investment gains earned in this example are just shy of $1.4 million. However, nearly 60% of those profits come in the last six years. Compounding is back-loaded, so it takes perseverance.
The reason compounding is so back-loaded is the fact that it takes time for the snowball to build once it starts going downhill. In the early years of investing when you have a smaller balance, your investment returns earn you interest on your original contributions plus any small amount of accumulated interest or gains. In your later years you’re earning interest on top of interest on top of interest and so on. If you compound $10,000 by 10% per year your annual return on investment would be $1,000 in the first year, more than $2,100 by the 10th year, $5,560 by year 20 and nearly $15,000 after 30 years of growth.
The problem is that it’s easier for your brain to understand linear growth as opposed to exponential growth. Walking up the stairs is linear growth. Each step is the same height. In most houses, that’s around seven inches. If you took 10 steps, it’s pretty easy to calculate how many inches up you are (7+7+7+7+7+7+7+7+7+7). Now let’s say you wanted to double the size of your stairs with every step. The first step would still be seven inches, the second 14", the third 28". At first it doesn’t feel that different. But by the 10th step, the rise alone would be over 30 feet high – taller than a three-story building. That’s compounding. Plus, there is the fact that you will be saving and investing more money as time goes on. It’s gains on top of gains on top of a bigger pile of money.
The hard part about investing in the real world is life does not work like an Excel spreadsheet. You cannot input your expected returns into a financial model and assume you’ll earn that number year in and year out. The stock market doesn’t work like that. Compounding in a retirement
calculator is neat and tidy. Compounding in the stock market is messy and lumpy.
Stock market returns are lumpy
Investing in the stock market would be far easier if you could simply bank on 10% each and every year. Unfortunately, it doesn’t work that way. There would be no risk if stock market returns were consistent each year. If there were no risk, the stock market wouldn’t offer such attractive returns. It’s the catch-22 of investing in risk assets.
If you want consistency over the long haul, you have to accept lower returns. And if you want higher returns over the long haul, you have to accept more volatility. You can never truly escape risk; you just change how you accept it.
The volatility of stocks is easily observable when looking at the year-to-year returns on the U.S. stock market, as shown in Figure 14.1.
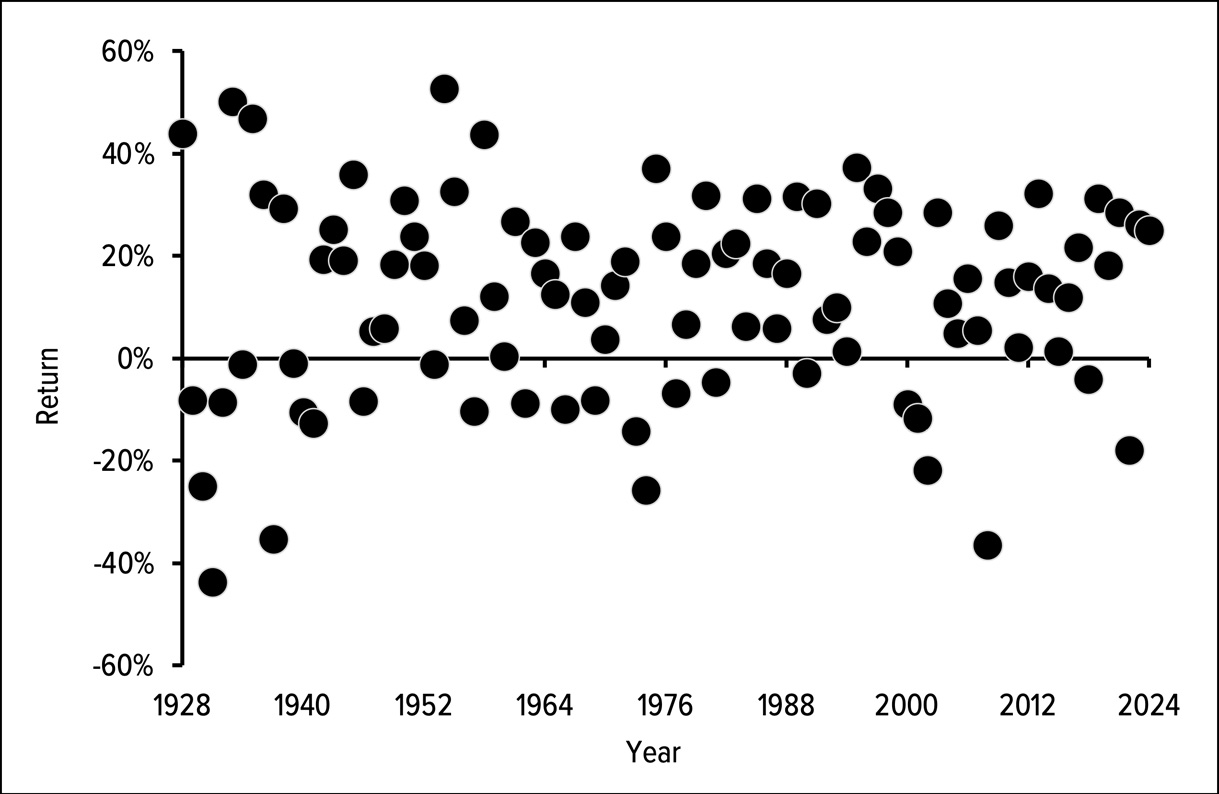
It’s like the returns are on a yo-yo from one year to the next. You could have periods of multiple down years in a row (like 1929 to 1932) or a cluster of positive years in a row (like 1995 to 1999). There are more gains than losses but no rhyme or reason when it comes to annual stock market returns.
Figure 14.2 shows another way of viewing these calendar year returns; as
you can see, annual stock market returns are anything but average.
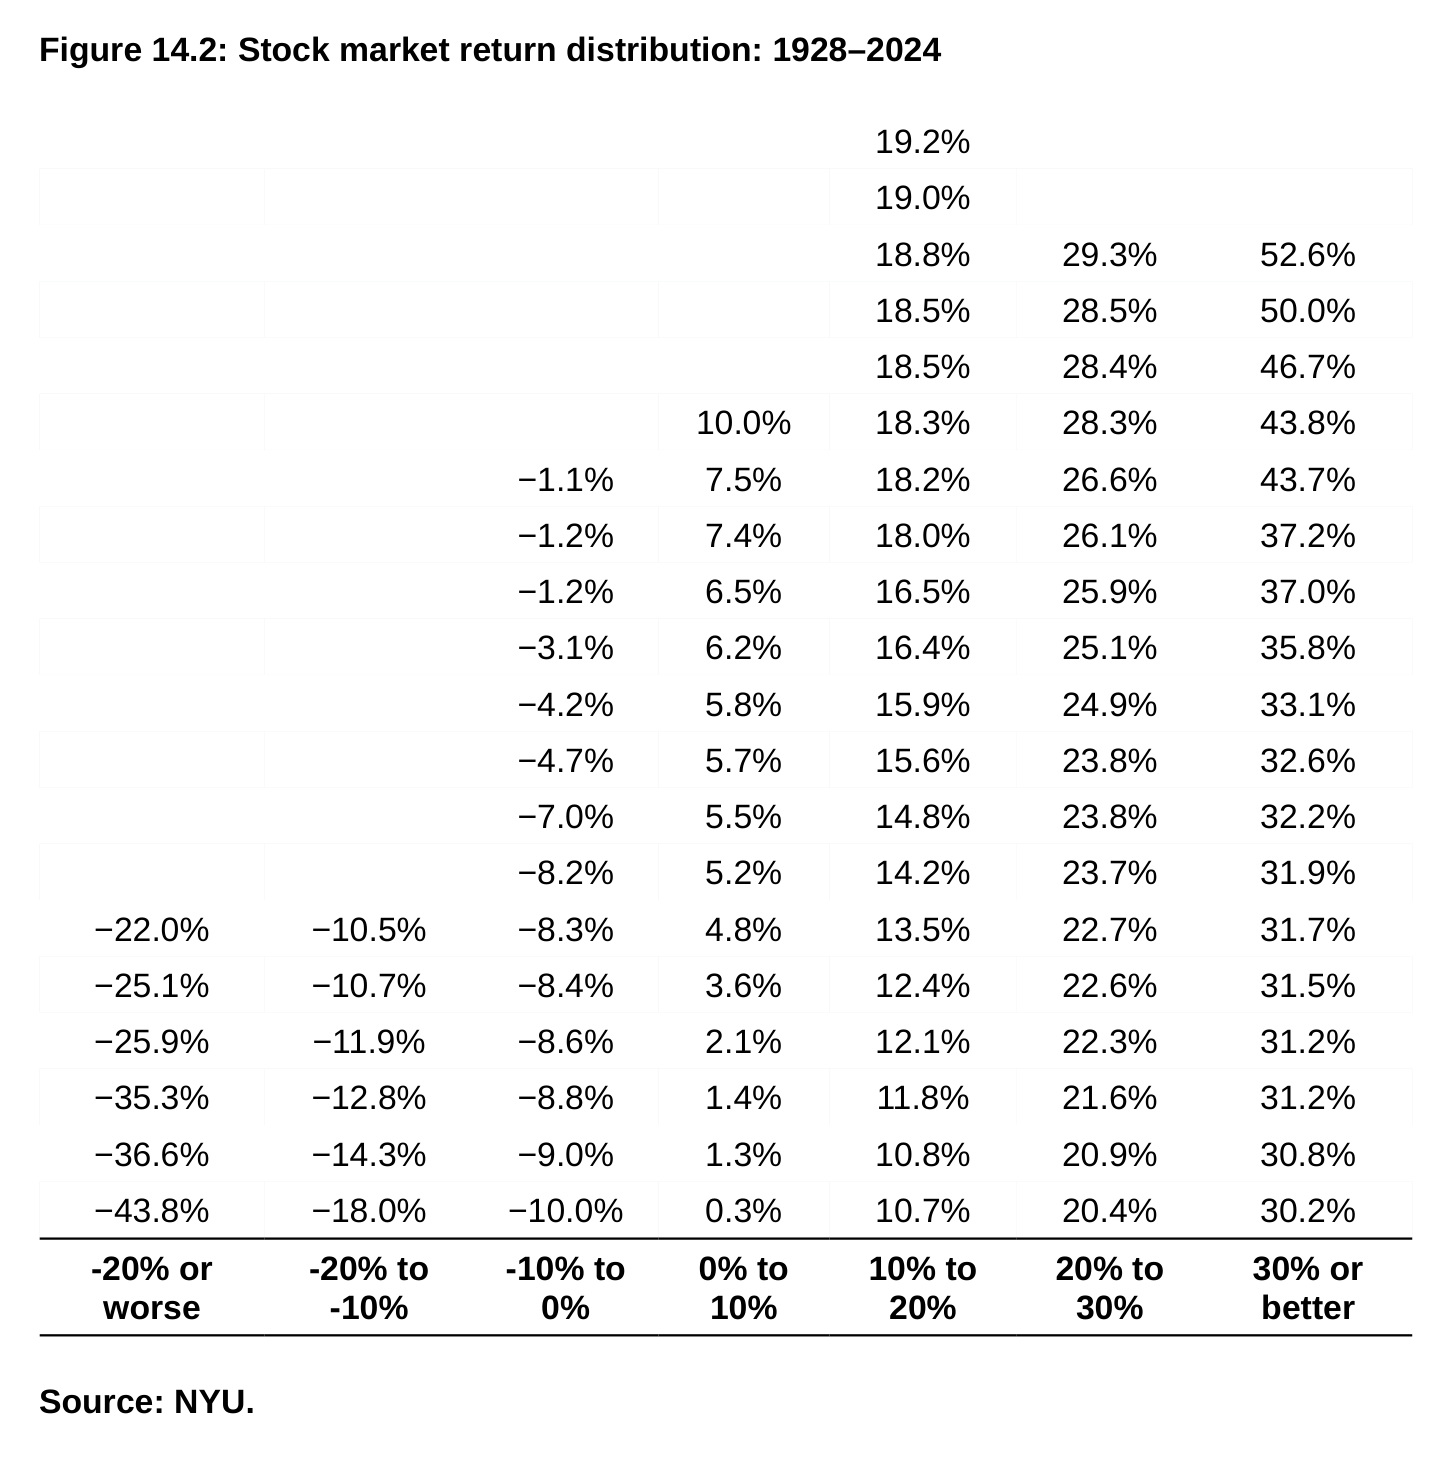
Figure 14.2: Stock market return distribution: 1928–2024 19.2% 19.0% 18.8% 29.3% 52.6% 18.5% 28.5% 50.0% 18.5% 28.4% 46.7% 10.0% 18.3% 28.3% 43.8% −1.1% 7.5% 18.2% 26.6% 43.7% −1.2% 7.4% 18.0% 26.1% 37.2% −1.2% 6.5% 16.5% 25.9% 37.0% −3.1% 6.2% 16.4% 25.1% 35.8% −4.2% 5.8% 15.9% 24.9% 33.1% −4.7% 5.7% 15.6% 23.8% 32.6% −7.0% 5.5% 14.8% 23.8% 32.2% −8.2% 5.2% 14.2% 23.7% 31.9% −22.0% −10.5% −8.3% 4.8% 13.5% 22.7% 31.7% −25.1% −10.7% −8.4% 3.6% 12.4% 22.6% 31.5% −25.9% −11.9% −8.6% 2.1% 12.1% 22.3% 31.2% −35.3% −12.8% −8.8% 1.4% 11.8% 21.6% 31.2% −36.6% −14.3% −9.0% 1.3% 10.8% 20.9% 30.8% −43.8% −18.0% −10.0% 0.3% 10.7% 20.4% 30.2% -20% or -20% to -10% to 0% to 10% to 20% to 30% or worse -10% 0% 10% 20% 30% better Source: NYU.
One of the strangest aspects of stock market returns in any given year is how seldom they finish around the long-term average. Over the 97 years from 1928 to 2024, there were just three years in which returns finished in the 9% to 11% range. There is a lot of variation around the 10% long-run average.
Breaking things down a little further for calendar year returns from 1928 to 2024:
71 out of 97 years saw positive returns (73% of the time). 26 out of 97 years saw negative returns (27% of the time). 68 out of 97 years were double-digit gains or losses (70% of the time). 56 out of 97 years were double-digit gains (58% of the time). 12 out of 97 years were double-digit losses (12% of the time). 42 out of 97 years were gains or losses of 20% or more (43% of the time). 36 out of 97 years were gains of 20% or more (37% of the time). 6 out of 97 years were losses of 20% or worse (6% of the time).
Not only have stocks been up roughly three out of every four years on average, but they’ve shown double-digit gains or losses on a similar frequency. The stock market has finished the year with double-digit gains roughly six out of every 10 years. In contrast, it’s more like one out of every eight years for a double-digit loss. Nearly 40% of all years have seen a gain of 20% or more! Historically, you would have been more likely to experience a 20% gain than a down year in the stock market.
How you view the stock market also depends on your time horizon.
32 years of stock market returns
Figure 14.3 offers a different way to look at returns over various time horizons for the S&P 500 going back to 1993.
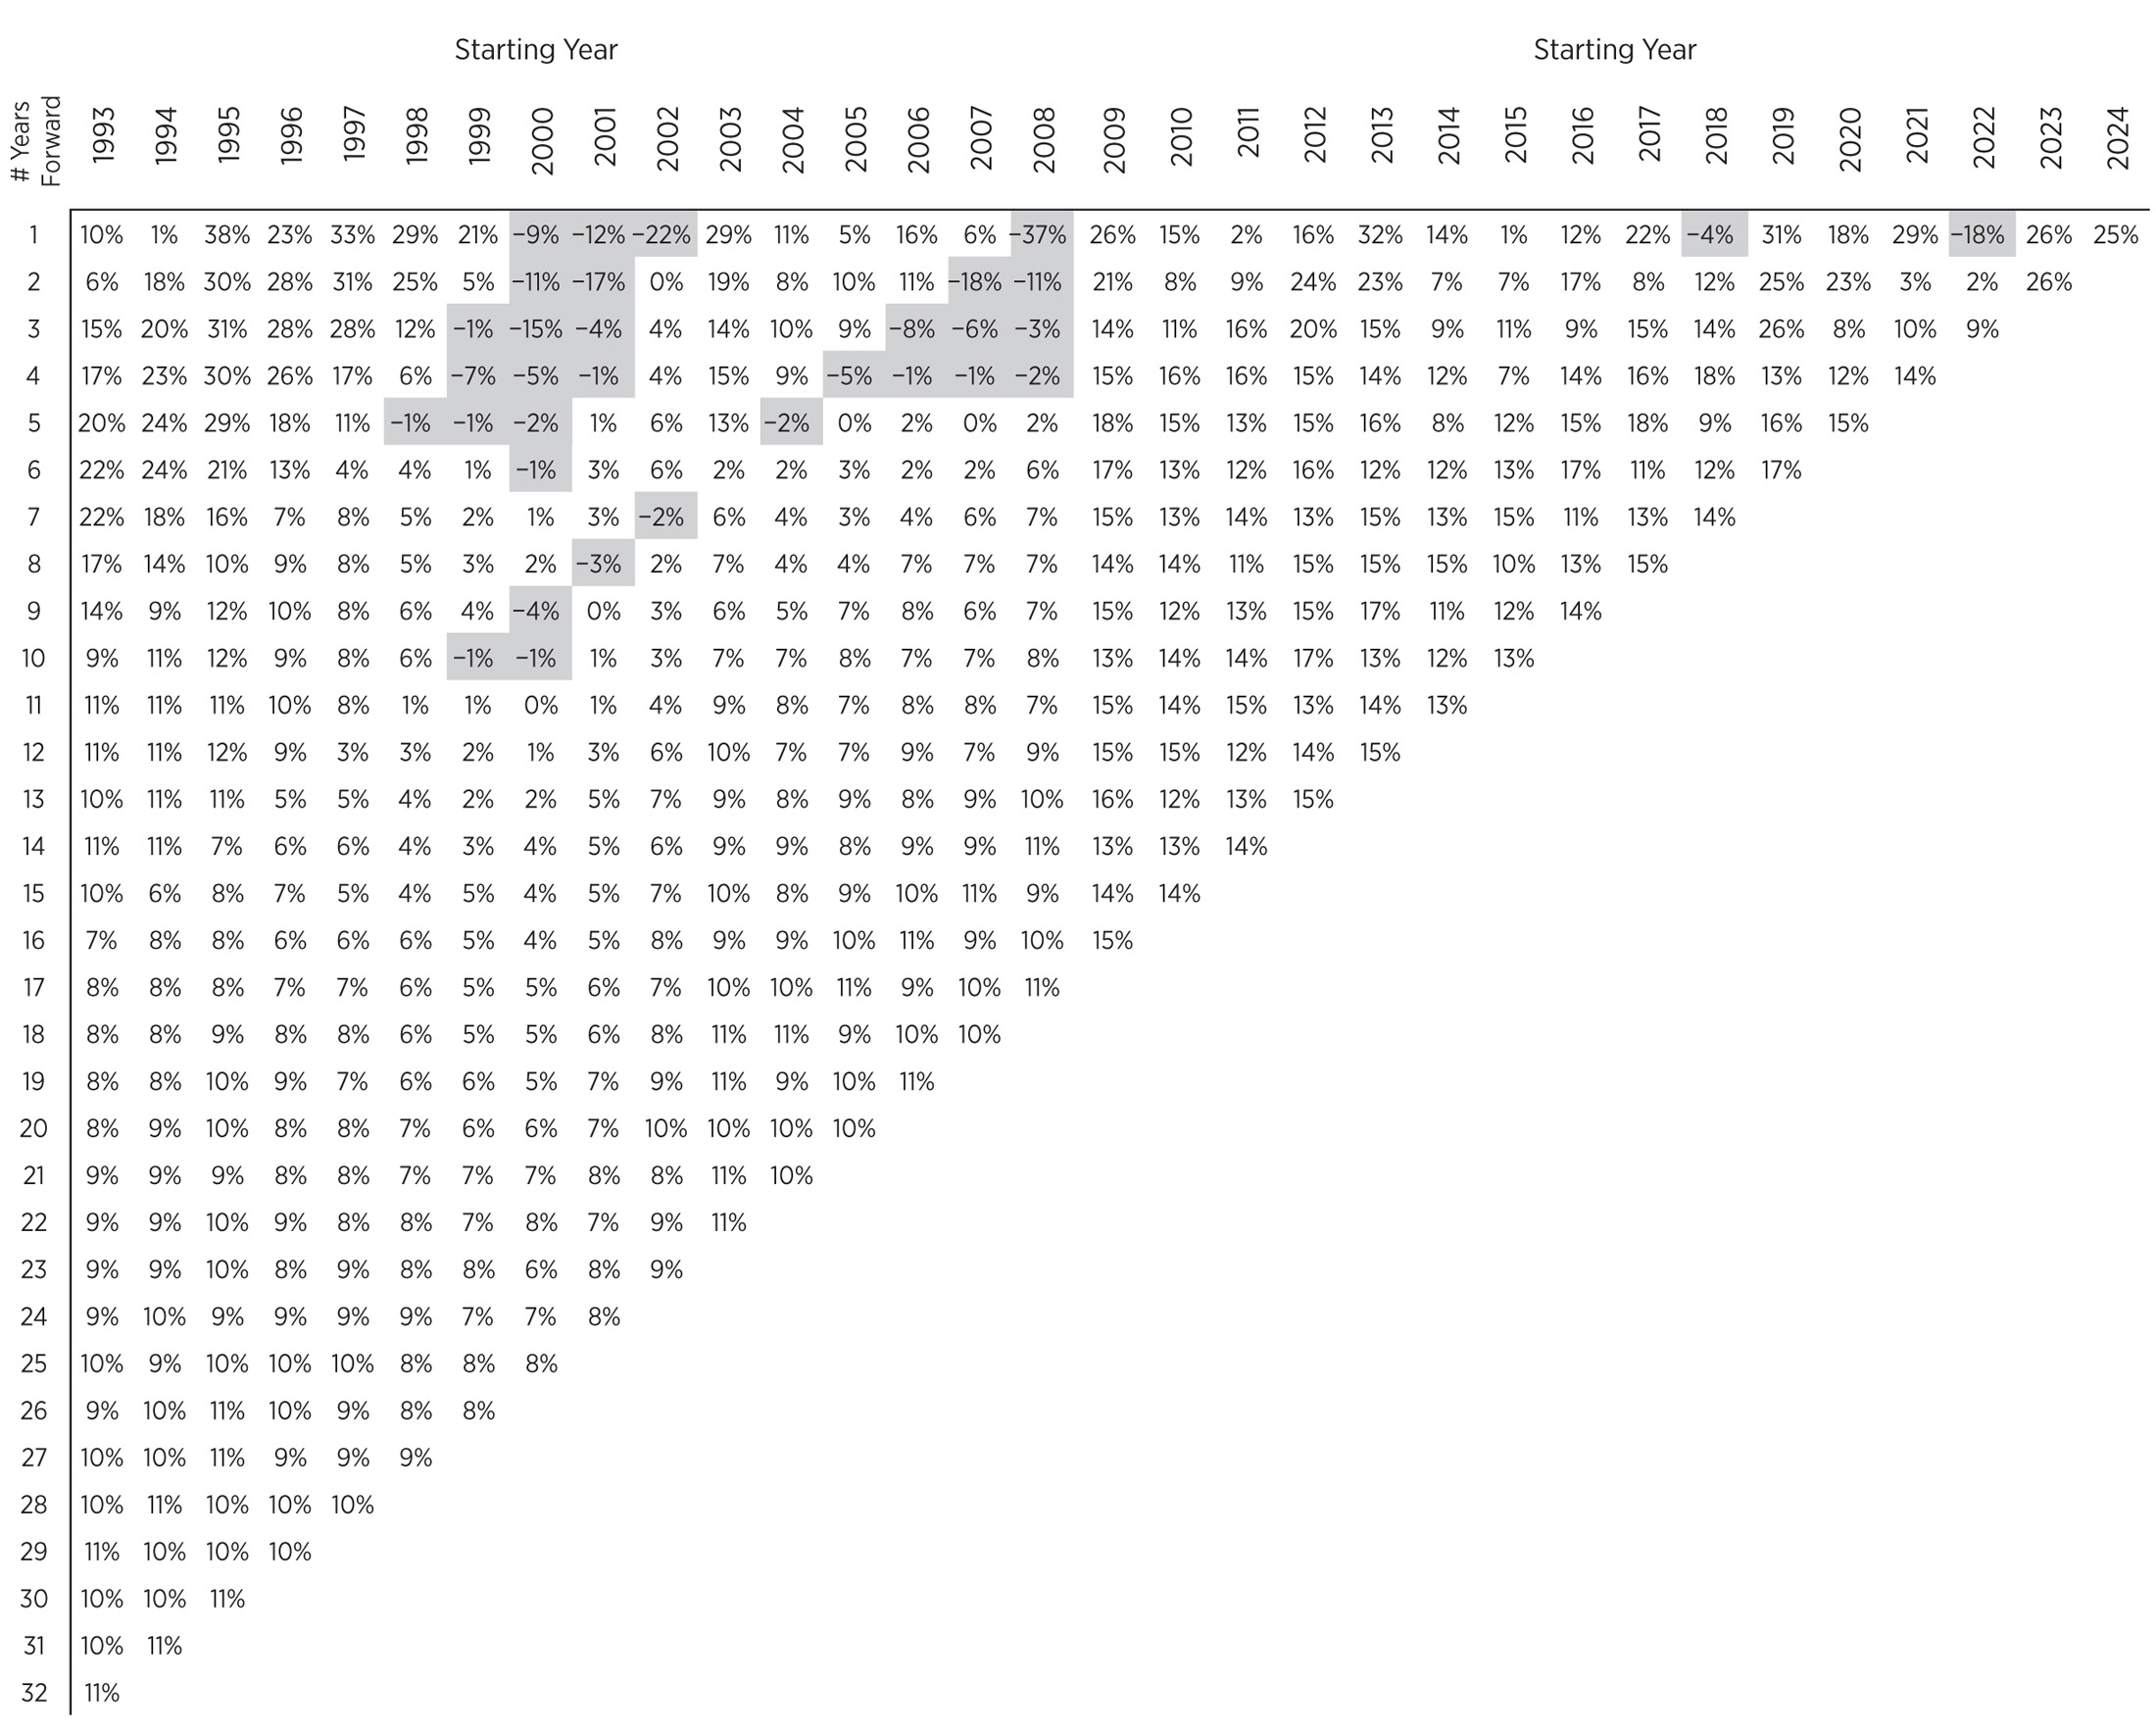
Here’s how to read this chart: Pick a starting year. Then, go down the number of years on the left-hand side and the corresponding square will tell you the annualized return from that starting point. For example, the nine-year annual return starting in 1993 was 14% per year. The 16-year annual return from 2005 was 10% per year.
I also highlighted the negative returns on the chart. There were far more positive returns than negative, but there were some painful periods for investors over this time. There were no losses going out 11 years or more, but starting in 1999 or 2000 led to a lost decade. You also had multiple instances of losses going out two, three, four and five years into the future. Five years can feel like an eternity when your investments aren’t earning you anything.
The range of outcomes is also interesting to consider. The 10-year annual returns ranged from -1% to 17% per year. Over 15 years there was a high of 14% per year compared to a low of just 4%. On a five-year time horizon the range was -2% to 29% annualized. Your experience in the stock market can vary drastically depending on your timing and your start or end point.
The good news is that the long-term removes a lot of variation from the equation. Look at the returns in the bottom left – they’re all in a fairly tight range. The 32-year annual return for the S&P 500 from 1993 to 2024 was 11% per year. In that time frame, we experienced an emerging markets currency crisis in 1998, the Long-Term Capital Management blow-up, the dot-com bubble, 9/11, the housing bubble, the Great Financial Crisis, the European Debt Crisis, the pandemic, the highest inflationary spike in four decades, and much more.
In bad years when everything is going down, you’ll always wish you would’ve taken less risk. In good years when everything is going up, you’ll always wish you would’ve taken more risk.
The important point here is that a longer time horizon is your friend as an investor. There will always be volatility over the short term. You could even experience godawful returns over a decade. But when you have a multi-decade time horizon, the compounding you experience in the stock market can be incredible.
Unfortunately for investors, it’s never been easier to pay such close attention to the short-term movements of the stock market. That makes the benefits even greater for those who can ignore the short term to focus on the long term.
Compounding is for patient people. Now let’s turn our attention to the biggest bubble in history to show how the stock market can test your patience.