Risk and Reward
Chapter 3
The Great Inflation
“A nickel ain’t worth a dime anymore.”
– YOGI BERRA
INFLATION IS A relatively new phenomenon.
In modern economic times, prices didn’t start rising on a sustained basis until the 1940s. From 1800 to 1940, prices rose at an average inflation rate of just 0.2% per year, meaning the cost of living was just 28% higher in 1940 than it was at the onset of the 19th century. There were nearly 70 separate periods of deflation, where prices fell.
The worst bout of deflation followed the Panic of 1873, also called the Long Depression, which saw prices fall 40% over the next two-plus decades.*
There were, of course, bouts of inflation in that time. It’s just that the deflationary busts balanced out the inflationary booms. That all changed following the Second World War. Before the 1940s, the biggest catalyst that drove U.S. economic cycles was war, mainly because there were so many of them. From the War of 1812 to the Civil War to the First World War, the economic cycle followed a fairly predictable pattern.
A Federal Reserve research paper from the 1940s outlined the four phases of post-war economies in the United States:
1. A period of uncertainty. This phase involved some turmoil and
confusion because the country moved from wartime spending and production to a more normal peacetime economy. 2. A post-war recovery. This phase involved speculation, an inflationary
spike and overheating from post-war excesses which would eventually
lead to a slowdown. 3. A post-war depression. The deflationary busts following the postwar
booms were brutal once government spending slowed. There were 13-year periods of deflation and stagnation following the War of 1812, the Civil War and the First World War, respectively. 4. Prosperity. This was the back-to-normal phase where companies were
all producing and selling goods as they were before the war and the economy got back on track.
The Second World War permanently disrupted this cycle. Although there was a significant post-war recovery in the late 1940s, it was not followed by a deflationary bust. Inflation surged during the initial boom, reaching as high as 19% in the years after the war, but then stabilized at a more moderate level without triggering a depression. The 1950s experienced substantial growth in the middle class as soldiers who returned from the war sought to build their lives in the suburbs, start families, buy homes, and spend some money.
Inflation has been on a new course ever since. Recall that inflation from 1800 to 1940 was less than 30% in total. Then from 1941 to 2024, prices in the United States rose 3.8% annually on average, or more than 2,200% in total. From 1941 to 1967, inflation averaged 3.3% per year in the U.S. That was much higher than previous cycles, but reasonable given the fact there were no more depressions and the economy was growing like crazy.
Then the train left the tracks. A combination of factors – including excessive government spending, the Vietnam War, supply chain issues and oil price shocks – contributed to unprecedented inflation in the 1970s. Inflation started getting out of control in the late 1960s and would go on a tear through the early 1980s. From 1968 to 1981, the inflation rate in the U.S. averaged 7.5% per year. It ended a year with double-digit inflation three times – in 1974, 1979 and 1980 – over this 14-year period. There wasn’t a single year in the entire decade of the 1970s when inflation came in below 3%. In eight out of the 10 years, the annual inflation rate was above 5%.
The 1950s and parts of the 1960s were boom times for investors. But the 1970s was a Mad Max hellscape. U.S. stock market performance was subpar in the 1970s, but not as bad as you’d think, at least on a nominal basis. The S&P 500 returned nearly 6% per year for the decade. Not bad, right? The problem is that the annual inflation rate was 7.4% in the 1970s, meaning stocks had negative real returns. The S&P 500 lost more than 26% of its value from 1970 to 1979 on an inflation-adjusted basis. On a real basis, the 1970s were about as bad as the 1930s.
As shown in Table 3.1, the 1970s is the only decade in modern economic history where cash (T-bills)* beat both stocks (S&P 500) and bonds (10-year Treasuries). In the 1970s, cash returned 6.3%, with bonds at 5.4% and stocks at 5.9%.
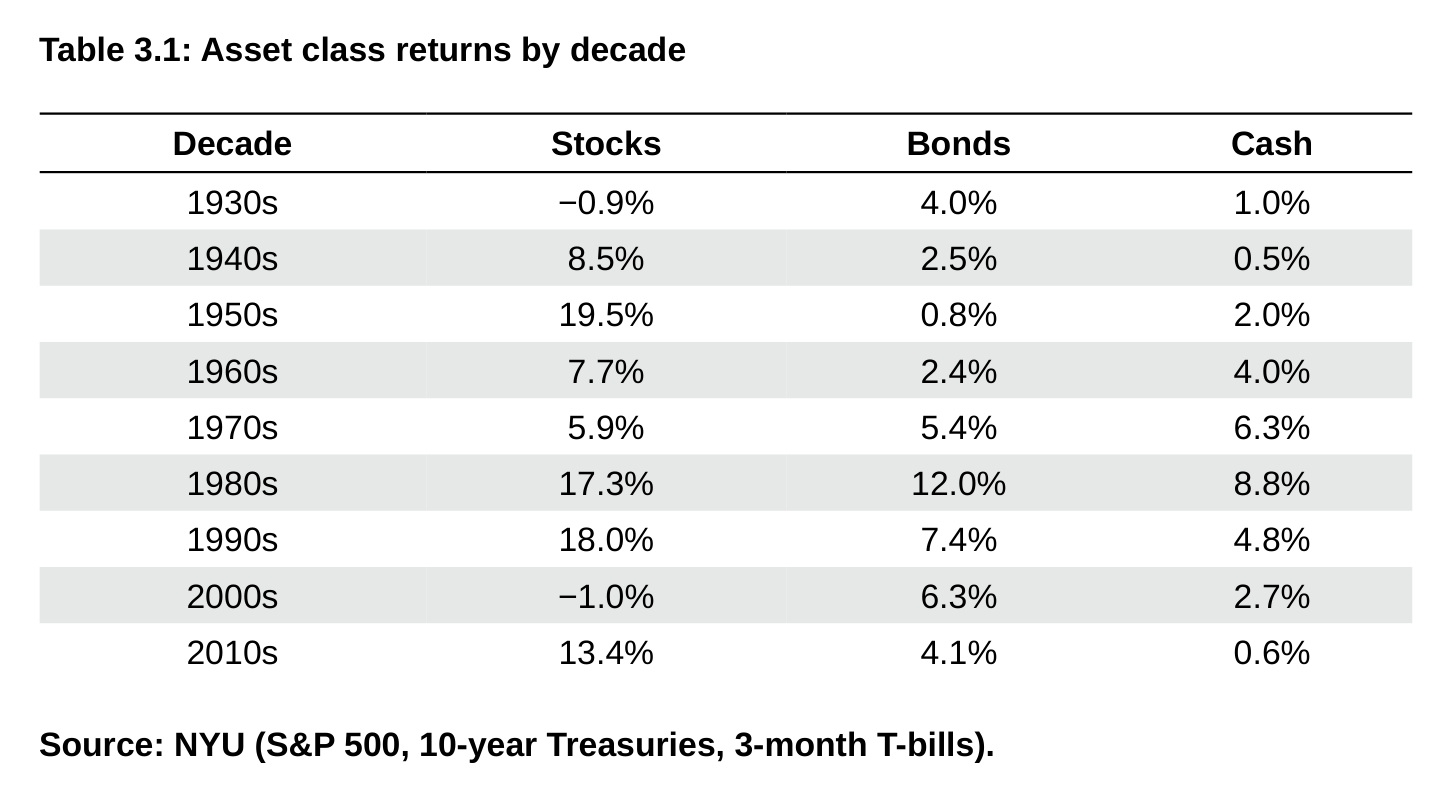
Table 3.1: Asset class returns by decade Decade Stocks Bonds Cash 1930s −0.9% 4.0% 1.0% 1940s 8.5% 2.5% 0.5% 1950s 19.5% 0.8% 2.0% 1960s 7.7% 2.4% 4.0% 1970s 5.9% 5.4% 6.3% 1980s 17.3% 12.0% 8.8% 1990s 18.0% 7.4% 4.8% 2000s −1.0% 6.3% 2.7% 2010s 13.4% 4.1% 0.6% Source: NYU (S&P 500, 10-year Treasuries, 3-month T-bills).
The 1970s weren’t just a poor decade for the stock market. Inflation wreaked havoc on the economy too, which performed dreadfully.
There was a recession to kick off the decade which lasted most of 1970. Then came the nasty downturn from late 1973 through the spring of 1975 when the unemployment rate reached nearly 9% and the stock market got cut in half. The inflation rate and unemployment finally declined following that downturn, but it didn’t last. High inflation wouldn’t go away. The Federal Reserve was forced to jack up interest rates into double-digit territory to tame the inflationary beast. Mortgage rates hit nearly 20% by 1982. It took two recessions in the first three years of the 1980s to finally break the back of inflation. The unemployment rate in the U.S. topped out
by the end of 1982 at almost 11%. The U.S. was in a recession for one-third of this dreadful period.
Everyone hates high inflation
In December 1970, the Time magazine cover story showed a picture of a dollar with a tear running down George Washington’s cheek. It said the dollar was worth 73 cents. By the end of the decade, one dollar in 1970 would be worth roughly 45 cents from the effects of inflation.
Gallup has surveyed Americans for 90 years, asking them about the country’s most important problems. The high cost of living ranked number one on the list of worries every year from 1973 to 1981. The populace despises high inflation with the hatred of a thousand suns and people in the 1970s made this known.
They didn’t just grumble about it – they protested. Truck drivers staged national strikes over gas price spikes and rationing. In Pennsylvania, one protest turned into a full-blown riot. Meanwhile, the housing market came to a screeching halt due to high mortgage rates, as few people were willing to take out loans at such exceptionally high interest rates. One homebuilder scribbled a note on a wooden block and sent it to Fed Chairman Paul Volcker, which read, “Dear Mr. Volcker, I am beginning to feel as useless as this knothole. Where will our children live?” A trade publication published a wanted poster of Volcker in 1982 accusing him and the Federal Reserve of “premeditated and cold-blooded murder of millions of small businesses.”
The New York Times published a front-page story in which they interviewed regular people across the country to see how inflation was impacting their lives:
In interviews across the country, The New York Times found that the ‘throwaway society’ of the late 1960s and early 1970s is being replaced, in many cases, by a new ethic of economy. People are driving cars longer and wearing clothes more often, planting their own gardens and fixing their own plumbing.
Many Americans use the same words to describe this new attitude: ‘We buy only what we need, not what we want.’ But this means that some of the juice of life, from new stereos to trips to the beach, is getting squeezed dry by the pressure of rising prices.
One of those interviews was with a bread salesman named Terry McLamb from Raleigh, North Carolina. McLamb was not fond of inflation:
Terry McLamb, the bread salesman, has seen his income rise from $9,000 to $15,000 a year in five years, but says: ‘I was getting along better on the lower income. It’s all got to come to a point somewhere, but I don’t know where.’
In the five years ending 1978, the consumer price index was up 47%. McLamb’s income rose 67% in that same period. His income outstripped inflation by 20%, yet he was miserable.*
That’s the insidious nature of inflation and why people hate it so much – even when you’re technically earning more, rising prices can make you feel like you’re falling behind. Workers see higher wages as something earned, while higher prices feel like theft.
Why is this the case? A Purdue University professor studied weekly sales data for eggs in California to determine how the price changes impacted consumer demand. In a rational world, you would expect consumer demand to change equally whether prices go up or down. That’s what they teach you in economics textbooks. If prices fall a little you would expect demand to rise a little. If prices rise a little, you would expect demand to fall a little. Economics 101.
But that’s not the case in the real world. In the real world, people have emotions that aren’t accounted for in economics textbooks and feelings can impact money decisions.
The researchers found that consumers do buy a little more when egg prices fall. But when egg prices rise, consumers cut back their consumption two-and-a-half times more. The fancy way of saying this is that egg prices have an asymmetric demand profile. When prices drop people buy a little more. But when prices rise, they cut way back on egg consumption.
People overreact to price gains because losses sting twice as bad as gains feel good.* You could call this irrational if you’d like, but this is who we are as humans. It’s in our DNA.
And that is why people hate inflation. It feels like a loss and losses are painful.
Warren Buffett explains how inflation impacts stocks
Investors are none too fond of inflation either. While the stock market is a wonderful hedge against inflation in the long term, it’s not a fan of rapidly rising prices in the short term.
Let’s take a look at the numbers. I calculated the returns for the S&P 500 in a given year when inflation was high, low, rising and falling from one year to the next from 1928 through 2024. The results are shown in Figure 3.1.
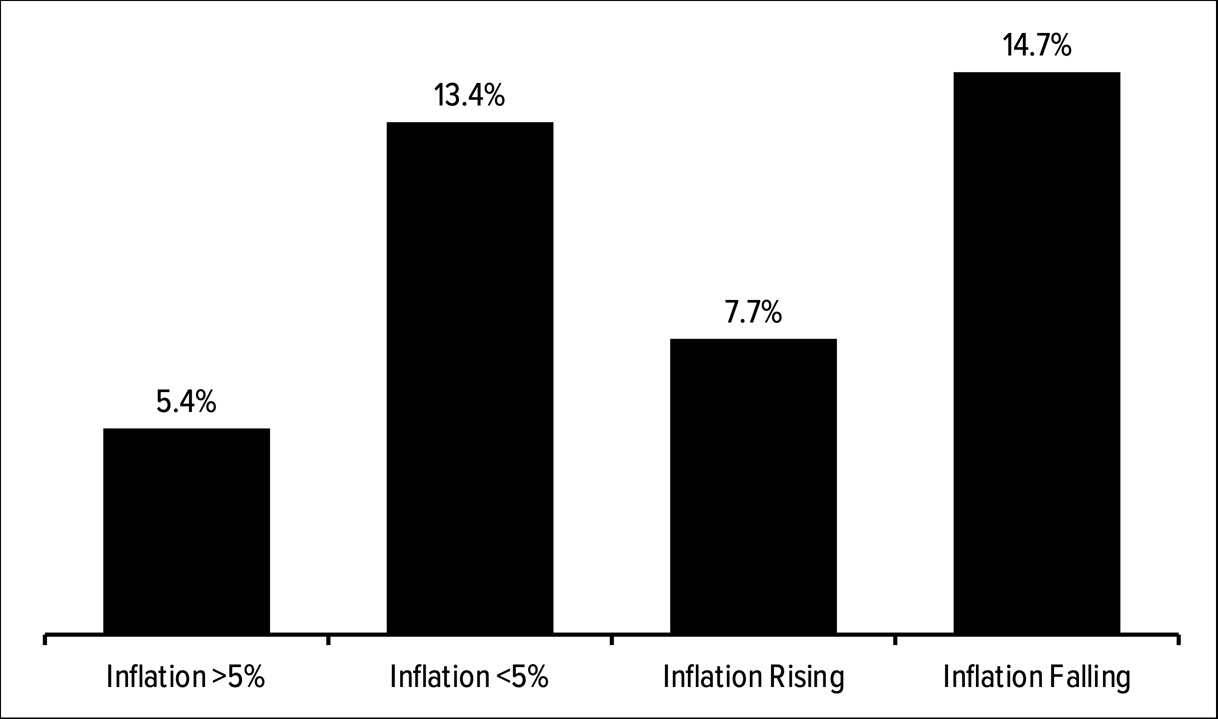
As a general rule of thumb, when inflation is high, average returns tend to be lower. When inflation is rising from one year to the next, average returns tend to be lower. When inflation is low, average returns tend to be higher. When inflation is falling from one year to the next, average returns tend to be higher. This is not always the case, but the stock market tends to have worse returns when inflation is high and/or rising.
Warren Buffett penned an op-ed in Fortune titled “How Inflation Swindles the Equity Investor” in 1977 that helps explain this phenomenon. The Oracle of Omaha’s main takeaway is that stocks are more similar to bonds than most investors assume, especially when it comes to investing during a highly inflationary environment:
The main reason, I believe, is that stocks, in economic substance, are really very similar to bonds.
I know that this belief will seem eccentric to many investors. They will immediately observe that the return on a bond (the coupon) is fixed, while the return on an equity investment (the company’s earnings) can vary substantially from one year to another. True enough. But anyone who examines the aggregate returns that have been earned by companies during the postwar years will discover something extraordinary: the returns on equity have in fact not varied much at all.
Buffett’s reasoning here is based on the idea that the return on equity (ROE) for U.S. corporations is relatively stable over time at around 12%. ROE measures how much profit corporations generate for every $1 of shareholder equity. Obviously, the prices people are willing to pay for that ROE can vary quite violently at times, but the ROE itself is relatively stable.
Using this framework, you can think of stocks as something of a perpetual bond that never comes due. If the ROE on stocks doesn’t change all that much, higher inflation would be harmful since investors would be receiving a lower share of profits after accounting for a higher cost of living.
Buffett explains:
Even if you agree that the 12% equity coupon is more or less immutable, you still may hope to do well with it in the years ahead. It’s conceivable that you will. After all, a lot of investors did well with it for a long time. But your future results will be governed by three variables: the relationship between book value and market value, the tax rate, and the inflation rate.
So there we are: 12% before taxes and inflation; 7% after taxes and before inflation; and maybe 0% after taxes and inflation. It hardly sounds like a formula that will keep all those cattle stampeding on TV.
As a common stockholder you will have more dollars, but you may have no more purchasing power.
Unfortunately, this means high inflation can be bad for both stocks and bonds.*
From 1950 through the end of 1981, long-term U.S. government bonds were up 2.1% per year. That’s not a great annual return, but it’s not terrible considering interest rates went from around 2% in the early 1950s to more than 15% by the early 1980s. Higher rates hurt initially, but they helped eventually as better yields lead to higher income payments. But those income payments come in the form of nominal dollars that don’t change. After inflation, long bonds lost nearly 60% of their value from 1950 to 1981. Inflation massacred fixed income along with household budgets and the economy.
The story of inflation is not merely about numbers or percentages; it’s about people – household budgets squeezed by rising prices, investors navigating volatile markets, and policymakers grappling with tough choices. The lesson to be learned from the Great Inflation of the 1970s is that rapidly rising prices have a huge impact on consumer psychology, household budgets, government policy, and your portfolio. One of the main reasons to invest for the long run is because inflation erodes your purchasing power. But you can beat the silent killer with a good job, a good mortgage, and ownership in good businesses through the stock market.