Risk and Reward
Chapter 16
Now Show Japan
“Everything ends badly, otherwise is wouldn’t end.”
– BRIAN FLANAGAN
IN 1955, DR. HENRY BEECHER published a research paper demonstrating that
“the placebo can have a powerful therapeutic effect.”
Beecher investigated the impact of the placebo effect on patients with various health issues. His findings revealed that giving a placebo medication improved pain management in 30–40% of patients suffering from injuries, asthma, high blood pressure, and even heart attacks.
Placebos are like using blanks in a gun – they have no actual, physical effect whatsoever. The theory behind the placebo effect is that it’s all psychological. You tell the patient there is a medication that can help, and the power of belief makes them feel better. Placebos sound good in theory, but we humans are complex creatures.
Most doctors have remained skeptical about the effectiveness of placebos. But what does the scientific evidence say? In the 21st century, two doctors set out to test Beecher’s theory through a series of clinical trials. Their research found minimal evidence that placebos provided any pain relief for patients in need. They concluded, “There is no justification for the use of placebos.” Published in 2001, their findings have remained unchallenged, leading to the conclusion that the placebo effect is not real.
So what’s going on here? Why did everyone get fooled by the placebo effect for so many decades?
The most straightforward answer is a reversion to the mean. Mean reversion is the idea that outlier events or values are likely to revert back to their average levels over time. In other words, if a variable is
significantly above or below its average in one period, it will likely move closer to the average in the following periods.
In the case of placebos, the average state for most people is good health. Most individuals who are sick or in pain eventually recover as the body heals and fights off illnesses that naturally resolve over time. People often seek medical help when their pain or symptoms are at the worst. Although it might appear that a placebo helps people feel better, the more straightforward explanation is that most people naturally improve from their lowest point.
Nobel Prize-winning behavioral expert Daniel Kahneman was once asked to analyze the performance of pilots in the Israeli Air Force. Flight instructors were trying to improve their incentive systems to better motivate the pilots. They observed that after a pilot performed exceptionally well and received praise, their next flight was usually worse. Conversely, pilots who had a poor flight were reprimanded and then showed improvement in their following flight. This led to the conclusion that praise was detrimental to performance, while punishment led to better results. However, Kahneman approached the issue from a different perspective and realized that the changes in performance were not due to the instructors’ feedback at all. They were simply a result of reversion to the mean.
Which brings us to Japan’s stock market.
Japan’s meanest of reversions
Just as the human body has a natural tendency to get sick and recover over time, financial markets also exhibit a similar pattern of self-correction. Whether it’s health or wealth, what goes down often comes back up and vice versa – not because of a miracle cure or market wizardry, but due to the powerful force of mean reversion.
When the stock market gets sick, sometimes the illness is more severe than others, but it does tend to get better even when it looks to be on its deathbed. On the other hand, the boom times never last forever and are inevitably followed by a bust. Above-average performance eventually leads to below-average performance and vice versa.
The hard part is that mean reversion doesn’t act on a set schedule. It’s unpredictable in terms of both timing and magnitude. Trees don’t grow to the sky, but it’s nearly impossible to know when they’re going to be cut in half because human nature is the wild card in the timing of these things.
Japan’s stock market experienced the meanest of reversions, but I’m going to tell you a little secret – Japan’s long-term returns are still pretty good.
Yes, it’s true! Japan’s stock market was stagnant for over three decades, delivering putrid long-term returns following the bursting of the largest asset bubble in history. But what if we combine the boom and the bust to see the full cycle?
Figure 16.1 shows the annual returns during both the bull market and the bear market phases, along with the entire 55-year time frame.
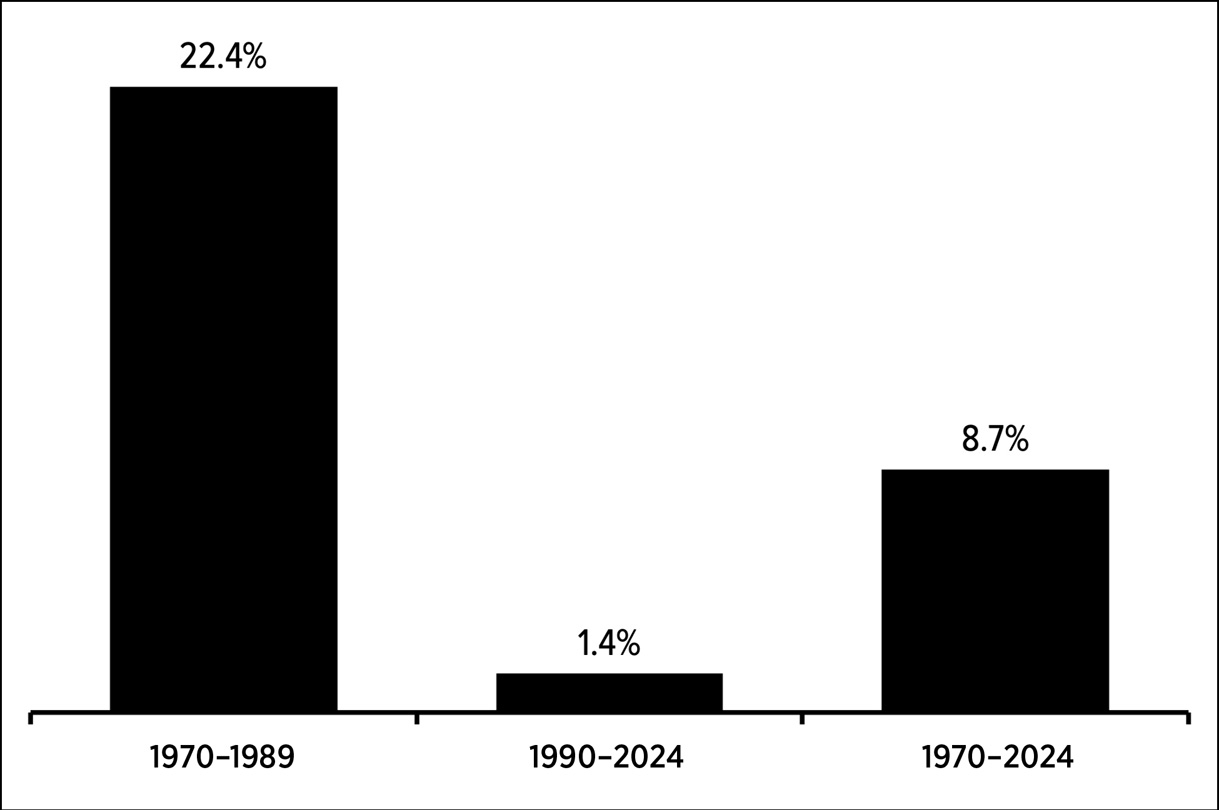
Over the long run, Japanese stocks are up nearly 9% per year. That’s lower than the 11% return for the U.S. stock market in that time, but it’s a respectable return over five-and-a-half decades.
Is this fun with numbers? In some ways, yes. You can win any argument you want about stock market history by changing your start and end dates. But who says 30 years is the definition of long term in the stock market? Over 50 years, Japanese stocks have done just fine. The problem is the 1980s bubble pulled forward decades of future returns as valuations went to Jupiter. Returns were so high in the 1970s and 1980s that you needed low returns in the ensuing decades to balance them out.
None of the Now Show Japan rebuttals to long-term buy-and-hold
investing ever mention this. The Japanese stock market has worked over the long term. The returns were simply compressed in a short period of time and then experienced mean reversion to even things out.
The lesson of Japan’s three-decade-long stock market malaise is not that long-term investing doesn’t work. It does! Japan’s lost decades teach us the importance of mean reversion. Valuations matter. Returns can’t stay abnormally high forever. And when building a portfolio, it’s important to avoid a single point of failure that can cause your investment performance to stagnate.
Avoiding a single point of failure
In 1995, Pixar Animation Studio was on a rocket ship of a growth trajectory. Toy Story came out in November to rave reviews and made more money than anyone thought possible. The first full-length animated film created entirely using computer-generated imagery (CGI) grossed over $360 million worldwide.
The Pixar team was riding high on their success, but Steve Jobs was already anticipating the company’s first failure. He persuaded co-founder Ed Catmull that it was only a matter of time before Pixar released a film that bombed at the box office. To brace for this possibility, Jobs encouraged Pixar to go public so they could secure the funding needed to withstand a potential flop. Jobs argued that expanding Pixar’s capital base would enable the company to fund its own projects and have greater control over its creative direction. More importantly, it would provide financial stability in case of a future failure. Jobs believed it was risky to rely solely on the success of each new release to sustain the company.
Catmull described his feelings about this idea in his excellent book, Creativity Inc.:
The underlying logic of his reasoning shook me: We were going to screw up, it was inevitable. And we didn’t know when or how. We had to prepare, then, for an unknown problem – a hidden problem. From that day on, I resolved to bring as many hidden problems as possible to light, a process that would require what might seem like an uncommon commitment to self-assessment. Having a financial cushion would help us recover from failure, and Steve was right to secure one. But the more important goal for me was to try to remain vigilant, to always be on the lookout for signs that we were screwing up – without knowing, of course, when that would occur or how it might come to light.
Leaders often ask their team to perform a post-mortem to understand what went wrong after the fact. Jobs was asking for a pre-mortem to anticipate what could go wrong in advance, without knowing what the trigger would be.
The fundamental data from the past – earnings, revenues, cash flows, dividends, etc. – is the easy part of investing. Data is ubiquitous. You can map out historical risk factors with pinpoint accuracy, but figuring out where the future risks lie is at best a guessing game. The future is unknowable because unexpected events happen all the time, and no one knows when our collective emotions will take the markets too high or too low. There is no predicting when a bubble the size of the Grand Canyon will form like it did in Japan during the 1980s and thrust returns into outer space, just like there is no predicting when a crash of epic proportions will bring it back to earth.
Investor Josh Wolfe once said, “Failure comes from a failure to imagine failure.” One of the best ways to manage these risks is to avoid having a single point of financial failure be your downfall. You do this in practice through diversification.
Exceptions to the rule
As the old saying goes, “The young man knows the rules, but the old man knows the exceptions.”
Japan’s dreadful three-decade-long returns don’t invalidate the need to think and act for the long term. They simply remind you of the risks involved in concentrating your investments in any one strategy or region of the world. This is the first single point of failure to avoid: avoid home country bias.
Each year, Elroy Dimson, Paul Marsh and Mike Staunton publish the “Global Investment Returns Yearbook” that updates the performance numbers for developed economy stock markets from the start of the 20th century. It’s over 100 years’ worth of data, which is obviously longer than
any individual’s time horizon. However, looking at the long-run returns can provide valuable lessons for investors.
Figure 16.2 shows the inflation-adjusted annual returns for 21 different stock markets around the globe starting in the year 1900.
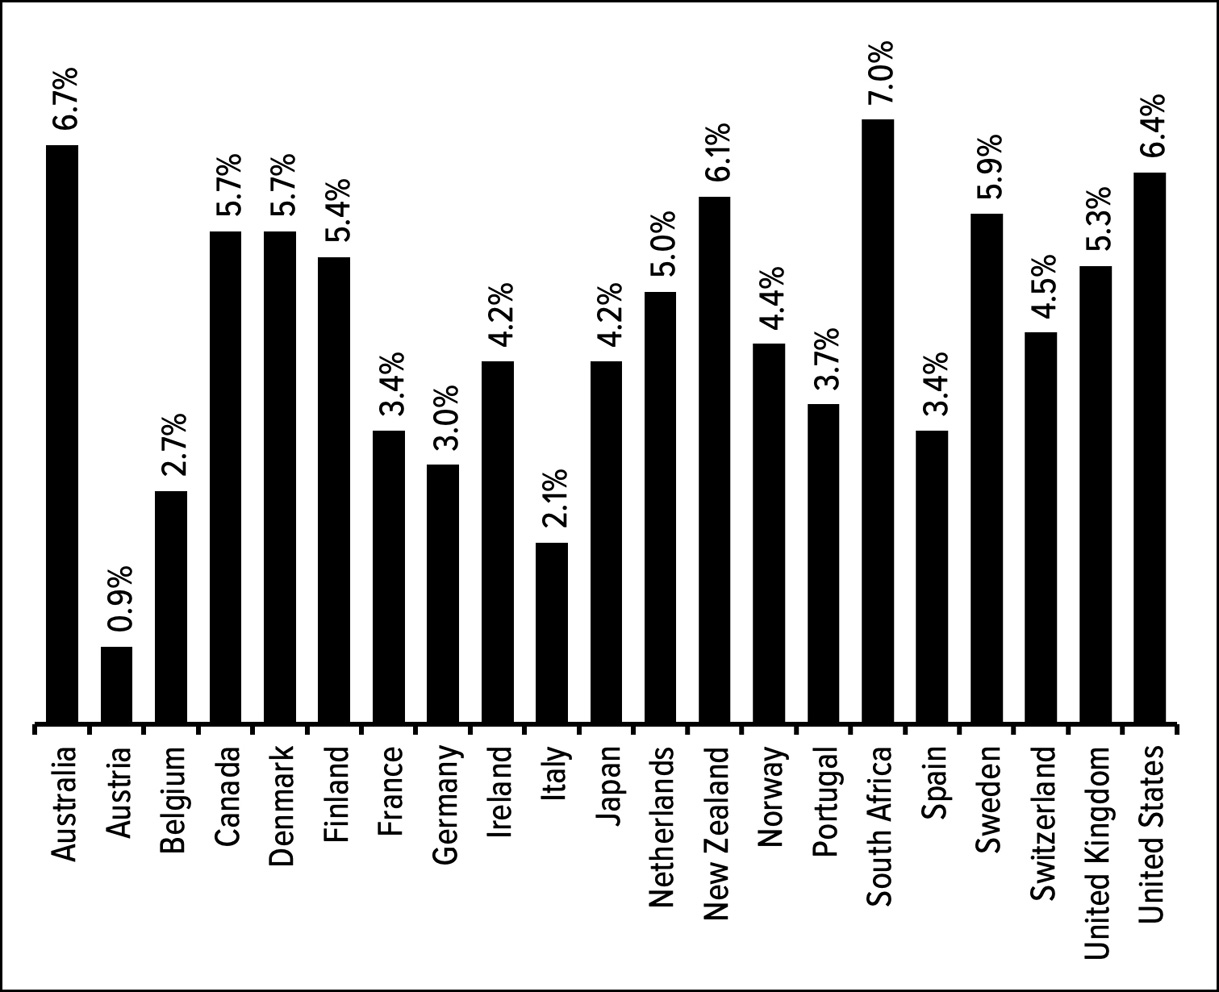
Some performance numbers are better than others. There are laggards – such as Austria, Italy, and Belgium – alongside the winners, like the United States, South Africa, and Australia. Japan’s long-run returns are respectable despite the appalling performance following the 1980s bubble. If you invested all of your money in Austria or Italy over the long haul you would be kicking yourself. If you invested all of your money in South Africa or the United States you would be congratulating yourself. The hard part about investing is it’s not easy to pick the winners or losers in advance.
Japan’s stock market returns from the 1989 peak have been grim, but the rest of the global stock market didn’t skip a beat. While Japan had a measly 1.4% annual return from 1990 to 2024, the MSCI All Country World Stock Market Index, which includes those terrible results from Japan, was up roughly 8% per year in that same time frame.
Yes, your performance would have been unpleasant if you had all of your money invested in Japanese equities since 1989, but if you diversified globally you would have done just fine. It’s a testament to the global stock market that other countries could pick up the slack when one of the biggest stock markets in the world goes through a multi-decade run of painful underperformance.
It would also be disingenuous to assume every investor in the Japanese stock market put all of their money to work right at the peak of the bubble at the end of 1989. Even our friend Bob from earlier in the book wouldn’t be that cursed.
Another way to avoid a single point of failure is by periodically investing your money into the market at different intervals, which is logically and naturally what most investors do most of the time anyway. For example, let’s say you wanted to invest $100 a month into Japan’s stock market over a 30-year period. You don’t get to choose when you’re born, so I looked at the results for the start of each 30-year period going back to 1970.
The best-case scenario would have been starting in 1970 which, of course, included the unbelievable 20-year run through 1989. You would have invested $36,000 in total, which would have turned into nearly $400,000 by 1999.* The worst-case scenario was a starting year of 1983, which led to an ending balance of $50,000. That’s not a great return over three decades of investing in risk assets, which makes sense considering multiple lost decades. These are the extremes. The average results from all 30-year investing periods starting in 1970 up to 1996 was an ending balance of around $100,000. You would have done much better investing elsewhere, but the result is not the end of the world.
Unfortunately, sometimes luck – both good and bad – in your timing has a bigger say in your investment success than you realize. It almost doesn’t seem fair. That’s the risk of concentrating your investments in any one strategy, asset class or region of the world. The story of Japan’s stock market serves as a powerful reminder that the journey of investing rarely occurs in a straight line.
Perhaps the most valuable takeaway is the importance of adaptability. Investors who stubbornly stuck to a single strategy or market paid a steep price.
You can’t predict when the inevitable long downturns will occur, but you can prepare for them in advance. If mean reversion is the law of gravity in investing, then diversification is your parachute. Japan doesn’t negate the power of buy-and-hold investing over the long run. Instead, it highlights the