Risk and Reward
Chapter 17
The Lost Decades
“That’s what diversification is for. It’s an explicit
recognition of ignorance.”
– PETER BERNSTEIN
“I DON’T REALLY KNOW anything about the company.”
That was Harold Davis, a doctor who purchased shares in the Netscape IPO in 1995. He flipped those shares 10 minutes later for a minor profit.
Netscape was the first internet browser to gain mass popularity in the 1990s. A few weeks before the company went public, bankers estimated the price at around $14 per share. Then demand went crazy, causing the investment bankers to raise the price to $28 on the day of the IPO. Even that wasn’t high enough. The stock opened trading at over $70 per share. Investors were thirsty for internet stocks. A stockbroker at the time told The Wall Street Journal, “People were desperate. The calls would come in from people saying, ‘I’ve never opened an account before, but this one I have to own. Can someone please, please, call me back?’”
By the end of the first trading day, Netscape sported a market cap of almost $3 billion. The company had yet to make a dime in profits. Kevin Kelly, a writer for Wired magazine at the time, explained, “Here was a company that basically had not only no profits, but it didn’t even have a suggestion of how it was going to make money.”
No one cared. When technological innovation ignites the animal spirits, all bets are off. Netscape was trading at more than $170 a share by the end of 1995. The dot-com boom was off and running.* That was 1995. The rest of the decade said: Hold my beer.
The bull market of the 1980s and 1990s ended with a bang as the dot-
com bubble took tech stocks to the moon. In 1999, nearly 350 stocks were up 100% or more. More than 100 stocks were up 300% or better, and an astonishing 13 stocks finished the year with gains in excess of 1,000%. The biggest winner in 1999 was Qualcomm, which gained an unbelievable 2,600%.
The dot-com bubble was one of the biggest parties in stock market history. And then the bubble went pop. The S&P 500 was down 50% over the ensuing three years. The Nasdaq experienced a Great Depression-level crash of more than 80%.
Surely investors learned their lesson. . . right? Financial historian John Kenneth Galbraith once wrote:
For practical purposes, the financial memory should be assumed to last, at a maximum, no more than 20 years. This is normally the time it takes for the recollection of one disaster to be erased and for some variant of previous dementia to come forward to capture the financial mind. It is also the time generally required for a new generation to come on the scene, impressed, as had been its predecessors, with its own innovative genius.
The Onion once ran a headline that read:
Recession-Plagued Nation Demands New Bubble To Invest In
The Onion is a satirical publication, but as we know, many a true word is said in jest. Sure enough, it didn’t take long for Americans to conjure up another bubble just a few short years after the dot-com boom and bust. And just like in Japan, this time, it was the housing market.
The housing bubble
Americans were still licking their wounds from the stock market crash in the early 2000s so they went looking elsewhere to calm their financial nerves. Much like the 1970s, the housing market was waiting with arms wide open. From 2000 to 2006, national housing prices surged by 54% after
inflation. That seven-year growth exceeded the total gains of the previous five decades combined.
There are a number of reasons for this. Americans became addicted to borrowing money as the economy slowed. Homeowners turned their house into a piggybank by borrowing against rising home values to fund their lifestyles. Wall Street was repacking mortgage-backed securities in unhealthy ways. Banks relaxed their lending standards. It was a confluence of events that also included low interest rates, easy access to credit, exotic mortgage loans, speculative behavior, a lack of regulatory oversight and human nature. To paraphrase Gordon Gekko from Wall Street, greed was good. . . until it wasn’t.
There is an infamous story of a strawberry picker named Alberto Ramirez who was given a $720,000 mortgage to buy a home in California despite an annual income of just $14,000.* Banks were extending loans they had no business making, but the risks were being repackaged and sold to investors who cared more about yield than credit quality. Homebuyers were taking on mortgages that were too big for their incomes, borrowing against them to take out even more debt and financing these purchases with adjustable-rate mortgages that became punitive as interest rates rose.
The free bowls of nickels Fred Schwed described in the run-up to the Great Depression were houses in the case of this bubble.
As always, the actions taken during a boom inevitably set up the bust. It’s a tale as old as markets. The dot-com bubble led to a stock market crash. The housing bubble would lead to one of the worst economic meltdowns since the Great Depression. It also gave investors one of the worst decades in U.S. stock market history.
The lost decades
The 1930s were downright ghastly. It’s hard to imagine the Great Depression will ever be topped in terms of economic pain in the modern era. The 1970s were exceedingly frustrating. Investors and consumers had nowhere to hide from sky-high inflation. However, you could make the case that the first decade of the 21st century caused the most financial upheaval because American households were more heavily invested in financial assets than ever before. Everyone had more to lose.
After the dot-com bubble popped in the spring of 2000, the S&P 500 was
in a bear market for the next two-and-a-half years. The stock market slowly but surely dug out of that hole after bottoming in October 2002 and finally hit new all-time highs by mid-2007. There were just nine new highs that year by the time the market peaked in October 2007 en route to the Great Financial Crisis. The financial system teetered on the edge of collapse throughout the fall of 2008 as the banking crisis went nuclear. In a White House meeting during the worst of the crisis, President George W. Bush told staffers, “If money isn’t loosened up, this sucker could go down.”
In September 2008, I vividly remember a hedge fund manager telling me and my colleagues to get as much cash out of the ATM on a Friday afternoon as we could, because the banks might not open on Monday. Lehman Brothers went under. Bailouts and takeovers were happening left and right. After plummeting 50% following the bursting of the dot-com bubble, the S&P 500 crashed 57% during the Great Financial Crisis before finally bottoming in March 2009.
The new century kicked off with a lost decade of epic proportions, bookended by two gigantic stock market crashes. From the start of 2000 through the end of 2009, the S&P 500 experienced a total return of roughly -10% (including dividends), or a loss of roughly 1% per year. The Nasdaq 100 finished the first decade of the 2000s down more than 48% in total, an annualized loss of 6.4% per year. It was ugly and caused an entire generation of buy-and-hold investors to question their love of stocks.
How could this happen? Lost decades are a painful reminder that you don’t get the risk premium without the risk. They don’t happen with regularity, but lost decades are part of the deal when it comes to investing in stocks.
Some unbelievable market facts
Consider the following crazy but true facts about the financial markets:
The total return from March 1997 through the bottom of the Great Financial Crisis in March 2009 was essentially 0%. The 2008 crash incinerated a dozen years’ worth of gains.
The period ending in March 2020 saw long-term government bonds beat the U.S. stock market for 25 years. From the spring of 1996 through March 2020, long-term U.S. Treasury bonds returned 8.2% annually versus a
return of 8.0% per year for the S&P 500. And they did so with one-third less volatility and not a single crash.*
From 1976 through the end of 2020, the U.S. bond market, as measured by the Bloomberg Aggregate Bond Index, had just three down years out of a total of 45. Those three losses were just -2.9%, -2.0% and -0.9%. In fact, there wasn’t a single double-digit drawdown over any 12-month period during that time frame. Then the bond bear market of 2022 hit with reckless abandon as interest rates and inflation spiked. The U.S. bond market would fall nearly 20% as interest rates rose precipitously to fight the post-pandemic inflation.
Gold compounded at more than 35% per year from 1970 through January 1980. That’s a total return of more than 1,900%, one of the greatest decade-long runs of any asset class in history. From January 1980 through the end of 2024, gold was up a total of little more than 400% or just 3.7% per year. On an inflation-adjusted basis, gold was still below the 1980 peak until 2025.
Holding cash in a savings account would have outperformed the U.S. stock market one out of every three years, on average, since the late-1920s. However, after accounting for inflation, U.S. 1-month Treasury bills once went 68 years with a negative return after inflation.
I’m having fun with numbers here but the point remains – everything underperforms eventually.
The cycle of fear and greed
It’s important to understand the emotional pendulum as it swings back and forth between fear and greed because you don’t want to get into the habit of buying high and selling low. Take a look at Figure 17.1, where I show the various bull and bear market cycles over the past nine-plus decades.
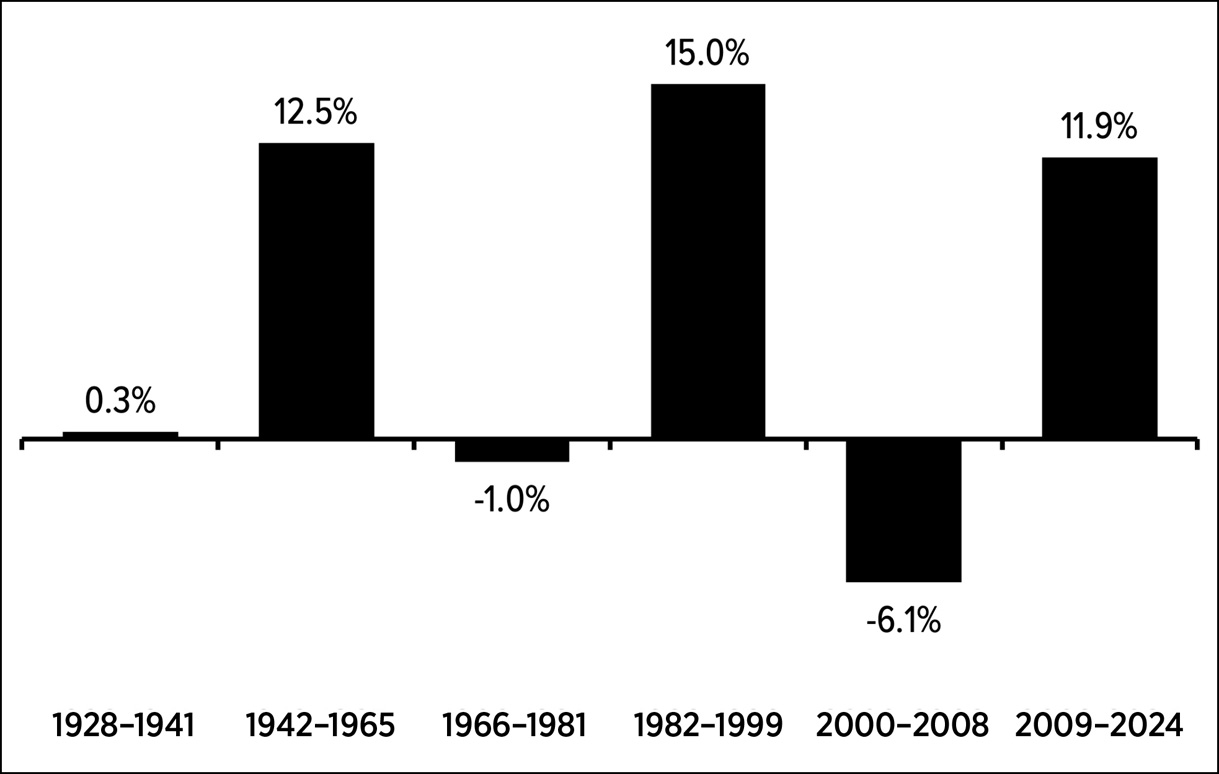
The good times and bad times can last much longer than you think, but some context is required. Sure, you can get lucky living through periods of stock market Nirvana by investing during an environment like the late 1940s through the 1950s, or the raging bull market of the 1980s and 1990s. But you don’t get those rip-roaring bull markets without the prospect of stocks going nowhere or even losing money like they did from 1928 to 1941 or 1966 to 1981. Markets are always and forever cyclical.
Investing would be much easier if you could avoid the drawn-out down cycles and go all-in during the bull markets. The hard part about the timing of these cycles is that no one really knows what the difference between a cyclical (short-term) and secular (long-term) bull market is in real time.
When the 1987 Black Monday crash caused the stock market to fall more than 20% in a single day, investors thought we were going into another depression. No one could have known the bull market still had another dozen years left to run at the time. The incredible bull market that started in the 1940s kicked off during the height of the Second World War. From 1942 to 1965, there were 13 separate double-digit corrections in the U.S. stock market, including four bear markets with losses in excess of 20%. These were countercyclical drawdowns within the context of a broader bull market. Two steps forward, one step back.
The terrible times have their moments too. During the inflation of the 1970s, the S&P 500 was up more than 260% in total from 1975 to 1980. Sandwiched between the dot-com crash and the Great Financial Crisis was a respectable 80% total return – 12.7% annualized – from 2003 to 2007.
The 1930s were a lost decade for investors, but the stock market was up 140% from 1933 to 1938 before taking a nosedive when the war started a year later.
The good news about lost decades is they don’t happen to every asset class at the same time.
All is not lost in a lost decade
The first decade of the 21st century was downright abysmal for the S&P 500. However, large cap U.S. stocks are not the only place to invest. There are plenty of other asset classes and strategies that don’t perform in line with the S&P 500 at all times. Figure 17.2 shows the total returns from 2000 to 2009 for the S&P 500 along with a handful of other asset classes and investment strategies.
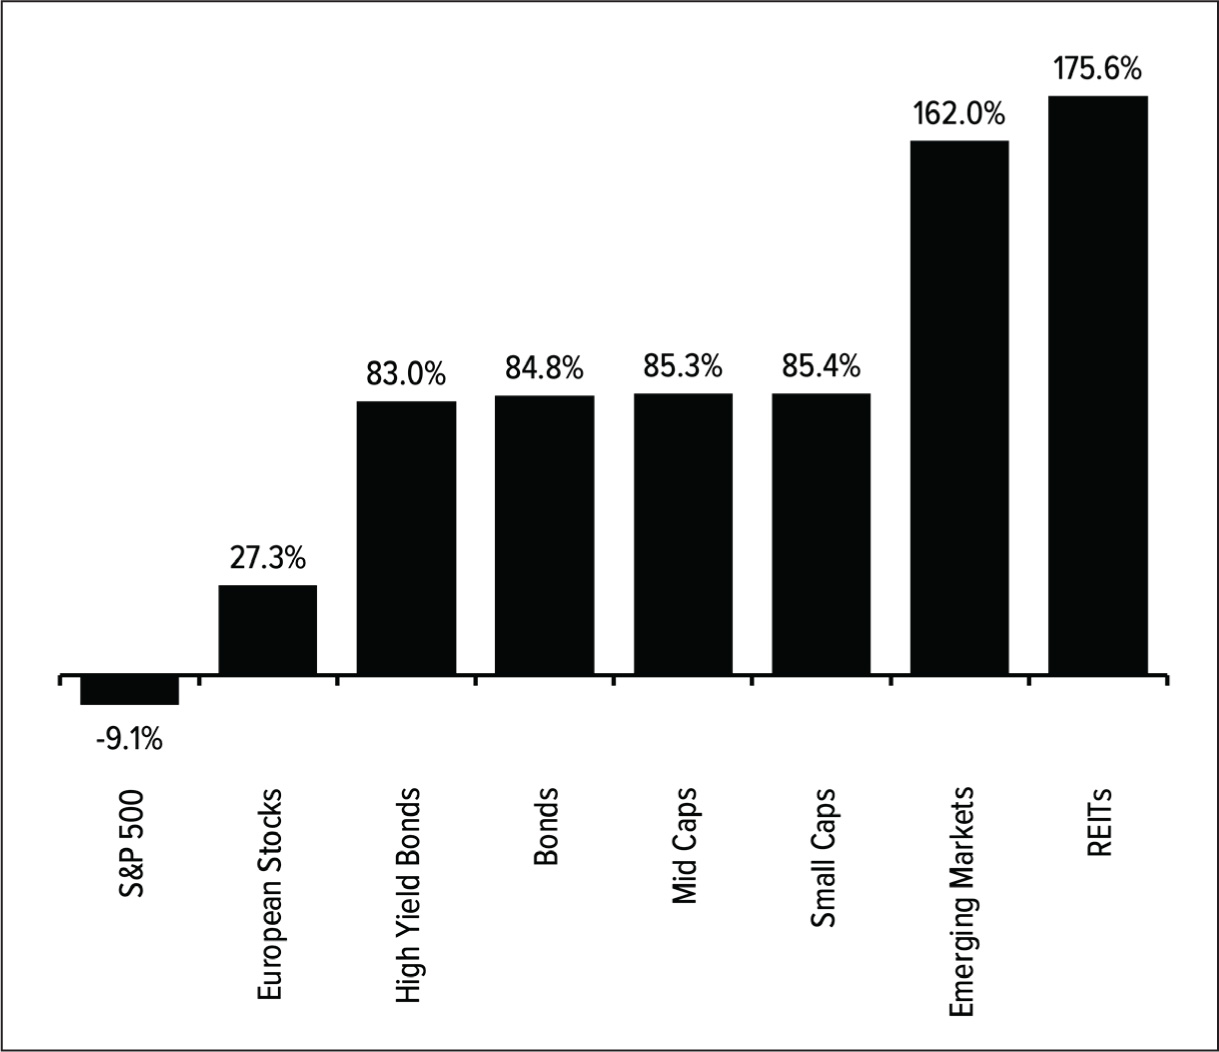
It wasn’t a lost decade for bonds, small caps, mid caps, international stocks, emerging markets and real estate. Each of these asset classes performed admirably for a decade that witnessed two recessions, including one of the worst financial crises in modern times. If you had all of your eggs in the S&P 500 basket, you experienced a painful decade. You had a
much smoother ride if you diversified and put those eggs in different baskets.
Howard Marks once wrote, “Here is part of the tradeoff with diversification. You must be diversified enough to survive bad times or bad luck so that skill and good process can have the chance to pay off over the long term.”
Diversification is not a free lunch. But spreading your bets can help you avoid being stuck in the only strategy that experiences an extended rough patch.
In the next chapter, we’ll look at some of the ways you can protect yourself from markets that go nowhere for an extended period of time.