The Portfolios
Chapter 10
The Flying Ladder Strategy
ON December 15, 1968, Second Lieutenant John Slater found his US Marine Force Recon team surrounded by Vietnamese soldiers. The recon team had been on the ground no more than 48 hours before being compromised and in desperate need of extraction.
Given the challenging terrain of the Vietnamese jungle, the team required a helicopter extraction using a device known as the “Jungle Penetrator.” The Jungle Penetrator was lowered from a helicopter on a winch and unfolded into a seat designed to fit a single person that could be hoisted up to safety.
The winch itself was only strong enough to hoist two men at most, but Captain Larry Adams was determined to save all seven men on the ground. The CH-46 helicopter made two trips under heavy fire, successfully extracting four men. As it returned for a third trip, Marine UH-1 Hueys provided cover, unleashing heavy fire on the enemy forces surrounding the recon team. Still, enemy troops were closing in dangerously on the remaining three Marines. The three men would have to board the Jungle Penetrator all at once, as the risk of a fourth trip was too high. As the helicopter lifted off, the winch struggled under the weight and was unable to reel the men into the aircraft, leaving them dangling beneath the chopper as it climbed hundreds of feet into the air. Captain Adams attempted to divert to a nearby sandbar several miles away for an emergency landing, but during the flight, one of the Marines lost his grip and tragically fell to his death.
After the failed extraction, Major Roger Simmons, Commanding Officer of First Force Recon, sought help from the army’s elite Studies and Observations Group to find an alternative to the Jungle Penetrator that could improve the efficiency of the extractions. One of the solutions he devised was a giant swinging ladder that could hold an entire recon team. The Simmons Rig, as it would come to be known, was never approved for official use, but came to be known as the “lifesaver from the sky” after the ladder was used in a pinch to extract eight stranded Marines in January 1969.24
The Flying Ladder Strategy, as I’ve named it, is not nearly the heroic device that was used in Vietnam, but I’ve used it increasingly to help save retirement plans.
Here’s how it works.
HOW THE FLYING LADDER STRATEGY WORKS
The Flying Ladder Strategy is what it sounds like – a bond ladder that’s attached to a flying equity component. This operates much like a barbelled strategy where the bond and equity components serve distinctly different roles to help provide both principal stability and growth in one clean portfolio. It’s called a barbell because the structure resembles an actual barbell with your holdings concentrated at the two extremes of the liquidity spectrum with little or nothing in between.*
I’d argue the Flying Ladder Strategy is best for someone who wants the structure and stability of predictable cash flows from the ladder component, while still having a need or desire for long-term growth.
While something like the Buffett Portfolio is specifically geared towards growth, the Flying Ladder is designed to create a very stable income-generating bond ladder with an aggressively barbelled growth/flying component to help generate high returns that can help enhance the future funding of the ladder’s income.
Let’s dig into each component in more detail.
The bond ladder
A bond ladder is a structured portfolio of bonds with staggered maturities, designed to help investors diversify their exposure across different time horizons, or “rungs” of the ladder.
For example, a 10-rung bond ladder might involve purchasing 10 bonds with maturities ranging from one to 10 years. As each bond matures, you “climb” the ladder by reinvesting the proceeds into a new 10-year bond, effectively rolling the ladder forward. When the one-year bond matures, the existing rungs shift down, and you add a new tenth rung. This ongoing process helps maintain a consistently rotating fixed income portfolio unlike holding a single duration bond, which gradually shortens in maturity and increases reinvestment risk over time.
Bond ladders help create consistent income, near-term certainty and constant maturity, thereby helping you plan for short-term liability needs across time while remaining diversified out across longer time horizons. They have an advantage over alternatives such as constant maturity aggregate bond funds because they’re disaggregated, providing you with liquidity access and avoiding homogeneous asset class risk that I discussed before.
Within the Flying Ladder Strategy, the ladder is a constant feature. But it flies because you attach that ladder to a more aggressive equity allocation that helps generate higher growth. This gives the ladder the potential for more sustainability by helping the entire portfolio ascend higher over time.
The optimal way to implement the helicopter is to allocate this part of the portfolio to aggressive high-growth equities that help this component achieve a high rate of ascent. One idea here is to take the Forward Cap Portfolio or factor tilts and mix them with a custom bond ladder.
This strategy works by providing strong principal stability and consistent income through the ladder component, while also isolating the stock allocation in a way that allows for meaningful growth alongside the fixed income holdings.
By compartmentalizing the assets in a systematic ladder and segmented growth component, the investor can remain more comfortable with their aggressive equity allocation knowing that their near-term fixed income needs are taken care of.
BUILDING YOUR OWN FLYING LADDER STRATEGY
As discussed above, this portfolio has two barbelled components – the bond ladder and flying equity piece.
The bond ladder can be customized as needed, but I’ll outline an easy way in which this can be done. For example, if you wanted to have a bond ladder with an average maturity of five years to meet income needs across 10 years, you would need to construct a 10-rung bond ladder. This could be done by buying 10 individual US government T-bills and T-notes as outlined below. For the equity piece we want to construct an aggressive equity allocation with a diversified stock position that tilts to higher-risk growth.
For this case study we’re going to use an example of a retiree who is 70 years old with a $1,000,000 portfolio who wants a steady stream of stable income of $25,000+ per year to supplement their Social Security income of $25,000 per year. If we assume an average interest rate of 4% the investor can achieve this by allocating 70% of their portfolio to the bond ladder and 30% of their portfolio to stocks.
As depicted in Figure 10.1, here’s how this might look:
$700,000 or 70% fixed income:
- 1 Year T-bill at 3.5% interest: $70,000 or a 7% allocation
- 2 Year T-note at 3.6%: $70,000 or 7%
- 3 Year T-note at 3.7%: $70,000 or 7%
- 4 Year T-note at 3.8%: $70,000 or 7%
- 5 Year T-note at 3.9%: $70,000 or 7%
- 6 Year T-note at 4.0%: $70,000 or 7%
- 7 Year T-note at 4.1%: $70,000 or 7%
- 8 Year T-note at 4.2%: $70,000 or 7%
- 9 Year T-note at 4.3%: $70,000 or 7%
- 10 Year T-note at 4.4%: $70,000 or 7%
While you could spice up your Flying component with something like the Forward Cap Portfolio, I am going to keep our equity piece nice and simple for illustrative purposes. Let’s use a domestic and foreign stock holding at global market cap weight with a tilt towards more aggressive growth-oriented positions.
This might look like this:
- Vanguard Total US Stocks (ticker: VTI): $60,000 or 6%
- Vanguard Foreign Ex-US (ticker: VXUS): $60,000 or 6%
- Vanguard Technology (ticker: VGT): $60,000 or 6%
- Vanguard Small Cap Growth (ticker: VBK): $60,000 or 6%
- Vanguard Emerging Markets (ticker: VWO): $60,000 or 6%
Figure 10.1: The Flying Ladder Portfolio
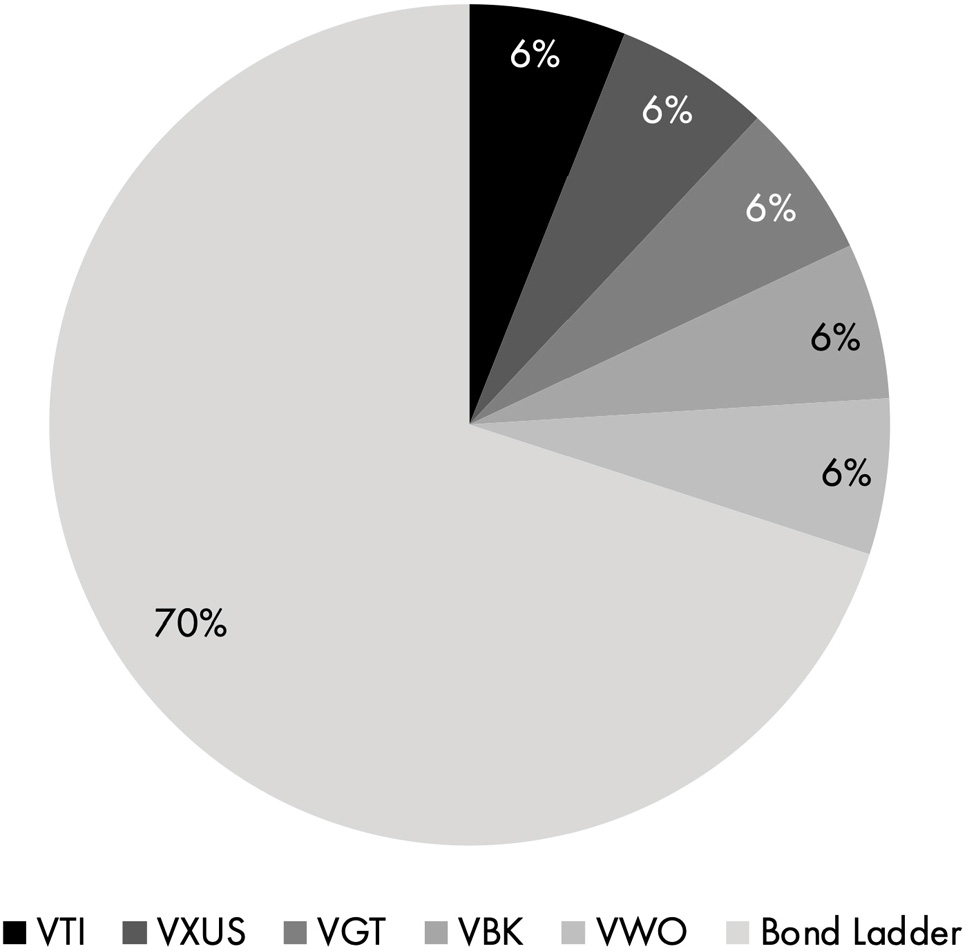
This gives the investor a secure and reliable income laddered over 10 years that provides approximately $28,000 of annual bond income as well as an aggressive growth component that will hopefully help fund further spending as the investor ages.
FLYING LADDER STRATEGY ANALYSIS
This portfolio allows for flexible implementation based on individual needs, and its performance will vary significantly depending on how heavily you weight the ladder component versus how aggressively you position the growth side – the higher you want your “chopper” to fly. These tilts will push the portfolio’s behavior closer to that of a higher-risk equity allocation or a more conservative bond ladder, depending on the balance you choose.
For our example above, which is relatively conservative given the large ladder allocation, we’re looking at something that’s very stable and relatively low-return. As shown in Figure 10.2, since 1995, this allocation would have generated about 4.21% annual returns with 6.09% volatility. The Ulcer Index, at 7.35, is very bond-like, but the equity slice helps it “fly” away from something like a pure bond portfolio.
Figure 10.2: Flying Ladder Portfolio performance
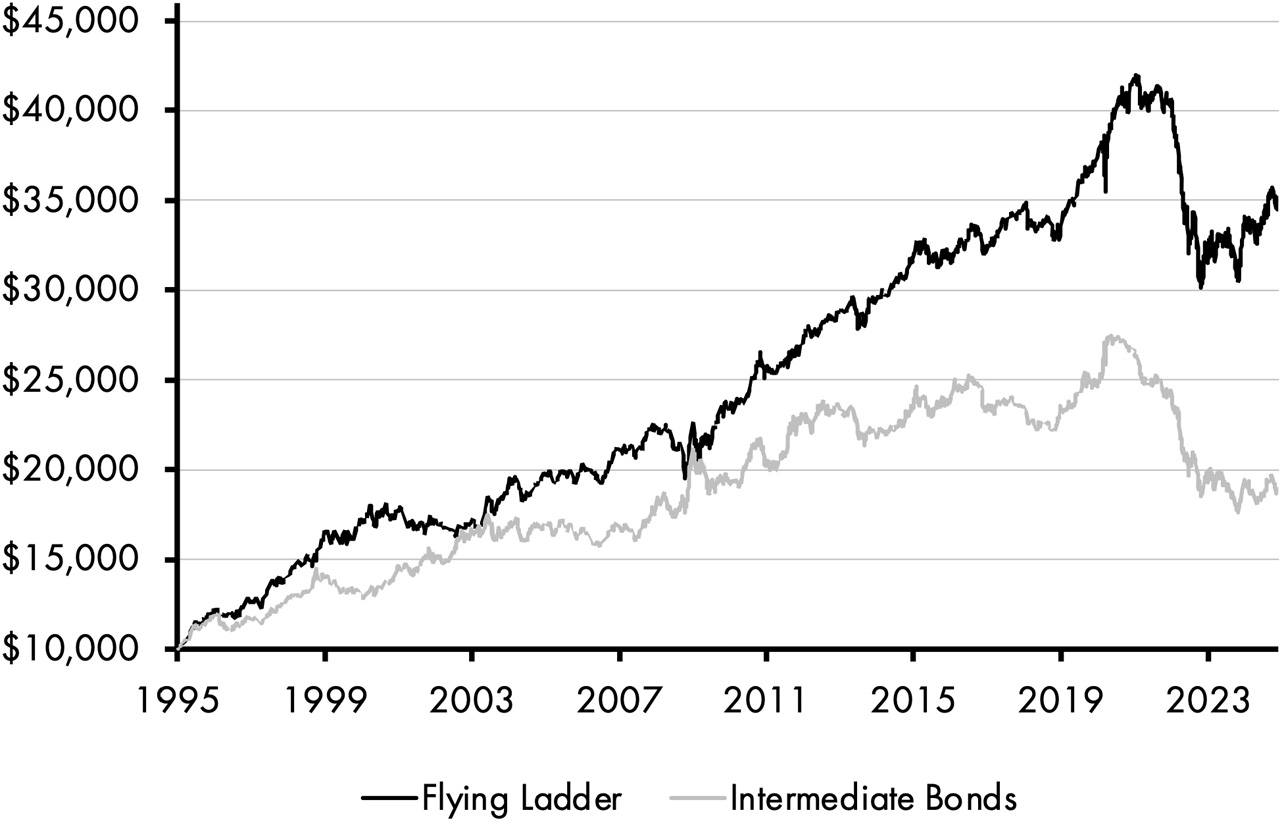
Table 10.1: Portfolio analysis
|
Flying Ladder |
Global Stocks |
Intermediate Bonds | |
|---|---|---|---|
Real Returns | 4.21% | 5.57% | 2.11% |
Volatility | 6.09% | 18.44% | 6.66% |
Sharpe Ratio | 0.74 | 0.40 | 0.37 |
Sortino Ratio | 1.06 | 0.55 | 0.53 |
Max Drawdown | −28.28% | −58.88% | −35.95% |
Ulcer Index | 7.35 | 18.58 | 11.11 |
Market Correlation | 0.19 | 0.88 | -0.08 |
Looking at the strategy’s max drawdowns (Figure 10.3) we see that with the exception of the Covid era, they tend to be relatively shallow, as expected. The low Ulcer Index shows us that these downturns tend to be highly tolerable given that they tend not to last too long. Keep in mind that the heavy allocation to bonds in our example, combined with the uniqueness of Covid, and the Fed lifting rates quickly from 0% to 5%, makes the drawdown look worse than it is likely to be in the future. And even during the Covid era the Flying Ladder experiences shallower drawdowns than a pure bond portfolio.
Figure 10.3: Flying Ladder Portfolio max drawdowns (%)
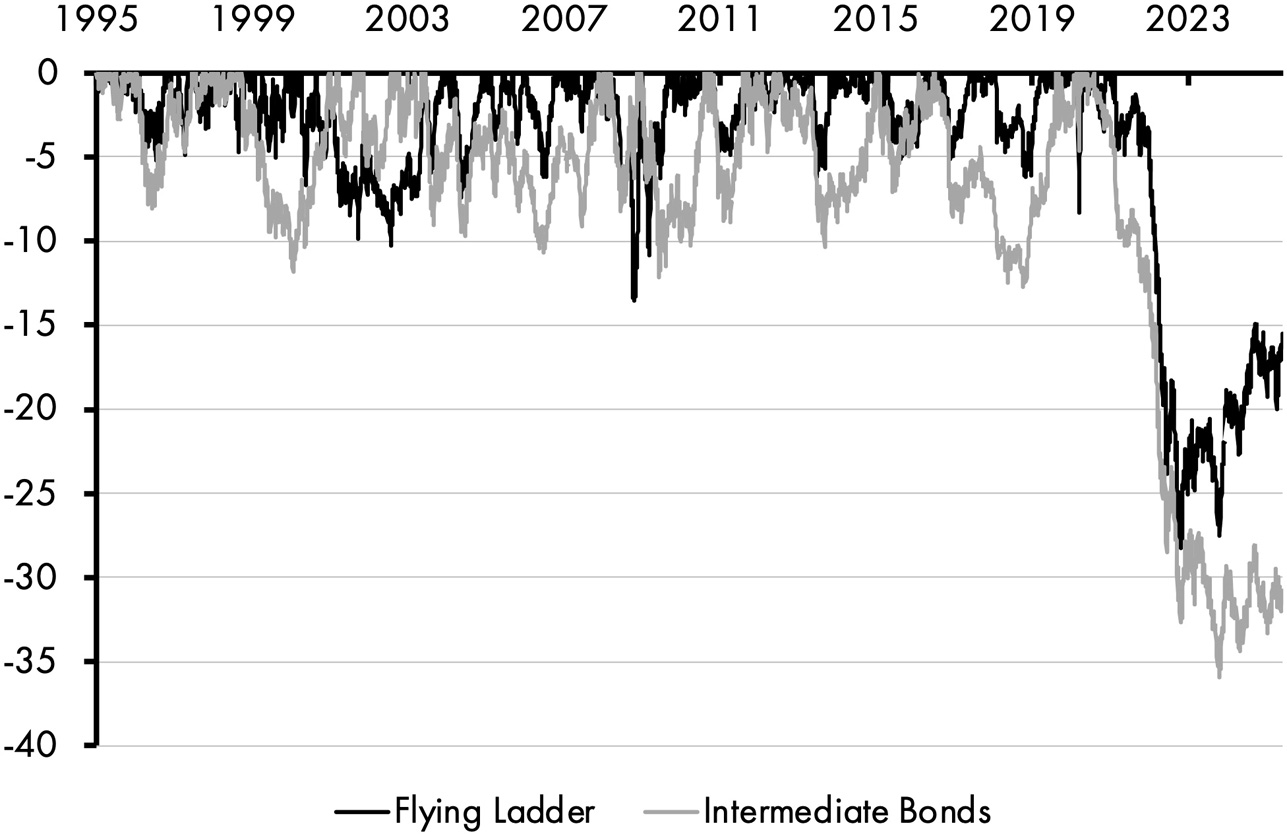
The equity piece alone does a nice job of flying here as it would have generated 6.80% per year as a standalone component, compared to 5.57% for the global stock market, with similar risk characteristics. Remember, we want an aggressive equity slice on its own, that hopefully outperforms broader stocks due to its more aggressive tilts, combined with the much more conservative bond allocation.
FLYING LADDER STRATEGY PROS AND CONS
What is good and bad about this portfolio? Bad news first:
- Barbell portfolios aren’t traditionally diversified across a broad range of asset classes – they’re concentrated at the extremes. This structure offers diversification across risk profiles and time horizons, but not across asset types in the traditional sense. The narrow positioning can expose investors to behavioral challenges – especially during periods of equity volatility or bond market shocks, like the inflation-driven rate spike in the post-Covid period.
- This portfolio is comprised of only equities and fixed income, so you will face the risk that these instruments become correlated in the short term.
- If you’re living off the income generated from the bond ladder then you will have withdrawal risk if your ladder gets smaller over time and needs to be funded in future years with equity returns that might not be reliable.
- The bond ladder requires ongoing attention, which may be overwhelming or impractical for some investors.
What about the good news?
- This portfolio is diversified, low-fee, and tax efficient. It can be implemented in a simplistic manner.
- The portfolio gives you a high degree of temporal certainty since the ladder is specifically designed to meet liquidity needs over a customizable time horizon.
- The portfolio has a cool name with a cooler origin story. Just imagine yourself at a BBQ with your friends and someone asks you how you allocate your assets: “Oh, I use the Flying Ladder Strategy, it’s a barbelled bond ladder with an aggressive equity tilt.” You’ll be the coolest guy at the party.
SUITORS FOR THE FLYING LADDER STRATEGY
The Flying Ladder Strategy is good for people who need reliable near-term principal stability and income, but also want a growth component in their portfolio to help make the bond ladder more viable in the long run. The ladder is the key component of this portfolio because it’s the part that makes it the most useful. After all, you’re not getting rescued from the market jungle without the ladder.
This portfolio could be especially helpful for retirees and others who are entering periods of near-term uncertainty. For the retiree who considers this portfolio you’d want to be someone who has a higher risk tolerance because the flying component will test your behavior at times. It could also be appropriate for a more aggressive investor who inverts the example above and creates a very aggressive equity allocation with a systematically structured bond ladder to serve as their bond portfolio.
This portfolio is flexible and can be customized, so it’s not constrained to only doing retirement rescues, even if that’s its best use case.
FINAL THOUGHTS
Well, there’s your Flying Ladder. It might not help you survive the jungles of Vietnam, but it might just save you in a financial pinch by creating some much-needed structure and stability.
Speaking of aviation heroes – let’s talk about a man named Taylor Larimore and how he went from jumping out of planes at the Battle of the Bulge to helping construct one of the most influential portfolios in investing history.