The Portfolios
Chapter 12
The Countercyclical Rebalancing Portfolio
IN a 2018 interview John Bogle, the father of passive indexing, described how he managed his own investments in an active manner at times:
We seem to come down to, for most investors, an idea that something like 65% stocks, 35% bonds is an intelligent allocation. Now, we know stocks are almost certain to do better in the long run just because of the nature of the capital markets, and so we said we want to do something to give us a little, you know, anchor to windward, dry powder, call it what you will, to protect you against behavioral mistakes and to give you some stability in your account and usually more income, although not much more today.
So if it’s 65/35 and for whatever sound, unemotional reason you can come up with, and the market looks substantially overvalued, don’t worry about if it gets 20% overvalued or 25% overvalued or undervalued by the same amount. But if it seems to get out of line by a substantial amount, take the 65 to 50. Take the 35 to 50 and be 50/50. But the idea of an all-or-nothing approach, ‘Well, I sold all my stocks yesterday.’ *eyeroll* You’re going to have a long, hard investment lifetime. Who can do that?27
While Bogle was a strong advocate for simplicity and low-cost investing, he wasn’t dogmatic about maintaining zero activity in a portfolio. He wasn’t an efficient market purist and recognized the importance of behavioral finance in financial planning. His commitment to low-cost investing was balanced by his philosophy of “staying the course.” He understood that some level of activity – such as rebalancing – could help investors remain comfortable with their portfolios and improve success rates over time.
Bogle was behaviorally active with his own money. During the Nasdaq bubble he said that he took his typically 70/30 stock/bond allocation to 30/70. He wasn’t trying to beat the market, he simply wasn’t comfortable holding 70% of his portfolio in stocks when valuations were so elevated. The fact that he happened to time the market well was part luck and partly sound behavioral management. But the point is Bogle wasn’t playing the “all-in” or “all-out” game like so many people do with their portfolios. He was staying the course even though he tilted the portfolio at times.
Bogle wasn’t the only smart indexing guru who was an advocate of rebalancing in a more adaptive manner. Nobel Prize winner William Sharpe, the creator of both CAPM and the Sharpe ratio, wrote a wonderful paper back in 2009 titled “Adaptive Asset Allocation Policies.”28
Sharpe’s focus was on the way that a 60/40 Portfolio will deviate from its underlying actual market caps over time and yet rebalances back to its fixed target with no regard for what actually happened in the markets. For example, during the 1990s, US stocks more than doubled in value. Rather than allowing for a higher equity allocation to reflect their growing share of total financial assets, a 60/40 Portfolio would have repeatedly rebalanced away from stocks. Sharpe argued that a more efficient approach would be to rebalance in a way that more closely tracks the evolving market portfolio, rather than anchoring to an arbitrary 60/40 split.
It’s interesting to consider Bogle and Sharpe side by side. While Sharpe is a more efficient market theorist, Bogle takes a more behavioralist view. They often arrive at similar conclusions, but through a very different lens. Sharpe would argue for tracking the total market portfolio, letting asset weights shift with market capitalizations. Bogle, on the other hand, might advocate for overbalancing away from the total market portfolio if it helps an investor stay more behaviorally grounded. So, just as he did, Bogle would want us to overbalance to bonds in the late 1990s for behavioral reasons. As noted earlier, this kind of behavioral tilt effectively inverts the GFAP – and, as we now know, would have delivered superior returns during that period.
While neither Sharpe nor Bogle ever formally endorsed a countercyclical strategy, we can extrapolate from their own management and rebalancing research that they would have agreed with something more adaptive than just a static 60/40 Portfolio all of the time.
WHY THE COUNTERCYCLICAL REBALANCING PORTFOLIO WORKS
This is another strategy that isn’t necessarily designed to beat the market. If anything, it’s aimed at creating a sound behavioral hedge so that you stick with your financial plan over time. It gradually shifts your stock exposure to better align with your comfort level and risk tolerance, helping you stay invested through different market conditions. While we might hope it leads to better risk-adjusted returns, the primary goal is to improve long-term outcomes by helping you stay the course – avoiding the temptation to jump in and out of the market.
The basic thinking behind this type of strategy is simple: when stocks rally, their higher prices often come with a greater risk of lower future returns. Conversely, when stock prices decline, their expected future returns tend to rise.
The valuation issue that Bogle mentions can be compounded at times. For example, we’ve already discussed the way in which your risk exposures in a stock/bond allocation are not balanced. But this imbalance can be exacerbated at the worst possible times. For instance, if you hold a 60/40 Portfolio in a year like 2007, you are exposed to far more risk in the 60% equity slice than you are in a year like 2009, because stocks are oftentimes less risky when they decline in value significantly.
While stocks are inherently more volatile than bonds, stocks are also much riskier in certain environments when compared to their historical average volatility. This is typically true at market extremes during big booms and busts. A countercyclical strategy can help you maintain discipline by adjusting exposures as risks increase or fade throughout economic and market cycles.
Further, most rebalancing can be considered countercyclical to some extent. When your 60/40 asset mix turns into 70/30 because the equities outperform the bonds, you might choose to rebalance the portfolio back to your original target allocation of 60/40. This is a countercyclical maneuver in the sense that you’re reducing exposure to the more inherently procyclical instrument. The trick is in finding the level of rebalancing that is right for you.
BUILDING YOUR OWN COUNTERCYCLICAL PORTFOLIO
Building the Countercyclical Rebalancing Portfolio (“Countercyclical Portfolio” for short) can be tricky because it requires some sort of systematic rebalancing model in a dynamic manner. Bogle cited high equity valuations as the main reason for his discomfort in 1999. While valuations can be relatively predictive of long-term returns, they don’t consistently exhibit short-term countercyclical behavior.
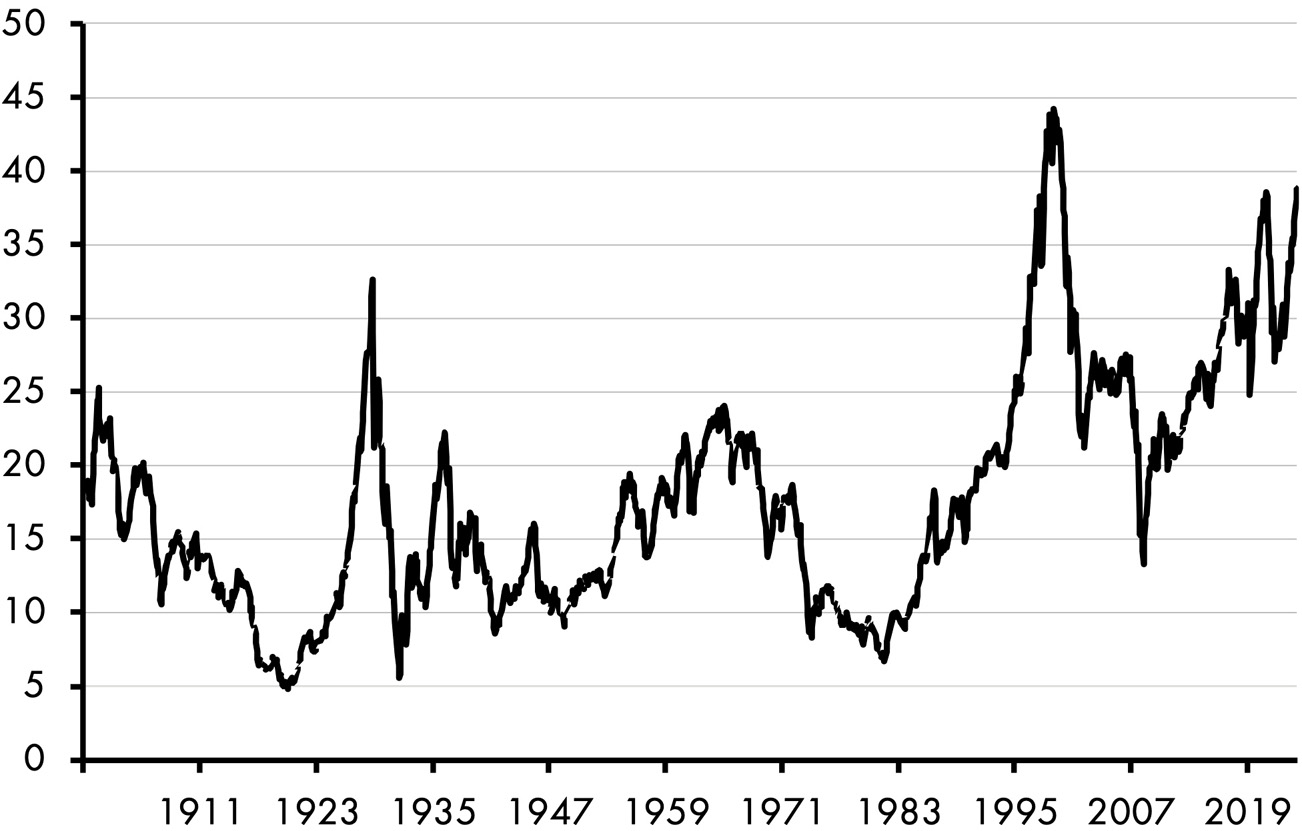
For example, the popular Shiller CAPE (Cyclically Adjusted Price-to-Earnings) ratio, which is designed to assess whether the stock market is overvalued or undervalued relative to historical norms, has been in a mostly higher trend for 45 years (see Figure 12.1). There has been no reliable way to use this metric on its own as a rebalancing tool. This was especially true in the last 30 years, when valuations soared during the tech bubble and only mean-reverted back to levels that would have been near-record highs in prior periods. Since then, valuations have remained elevated or continued drifting even higher.
The challenging part is designing a systematic approach that stays true to Bogle’s core principles while also applying a sensible countercyclical rebalancing strategy. Lucky for you, I’ve spent an unhealthy amount of time over the past decade thinking about exactly that – so let’s dig in.
Figure 12.1: Shiller CAPE ratio
FUN SIDE NOTE
Why have valuations been so high in recent years? There’s considerable debate about this, but I’ve concluded that it’s mostly due to increasing corporate margins. Technology, lower inflation and public policy have facilitated an increase in corporations’ cash flow over the last 30 years. Companies are operating more efficiently than ever and capturing a larger share of domestic income. As a result, equities have grown to represent a larger and more influential portion of overall financial assets – driven by this structural shift in corporate efficiency.
I’ve explored this concept through a variety of methodologies over the years and have found that incorporating valuations, credit spreads, and other macroeconomic indicators can help construct a sufficiently procyclical index – one that serves as a foundation for building a Countercyclical Portfolio. This index is maintained by my firm, Discipline Funds, and it also informs the approach we use in our own countercyclical strategies and can be implemented inside the Defined Duration strategies, discussed later.*
When I was originally trying to replicate Bogle’s approach, I found that valuations were too procyclical to utilize reliably. What you really want is a signal that behaves more like a sine wave over time – something that zigs when the stock market zags, and vice versa and also does so consistently across time. But to build that, you need to go beyond valuations and incorporate a more sophisticated set of indicators. Some people like Dan Rasmussen, the Founder of Verdad Capital and author of The Humble Investor, advocate for building a Countercyclical Portfolio using credit spreads. This is a clever addition, but the problem with credit spreads in solitude is that they’re countercyclical but would leave you underweight stocks for very long periods of time as credit spreads spend a lot more time at lower levels than they do at higher levels (which would oftentimes leave you too conservative for too long). Credit spreads are a better buy signal than they are an effective hold signal.
That said, if you’re looking for a very simple and systematic way to implement a countercyclical strategy, you can just follow credit spreads and apply a model where you’re buying more equities when credit spreads increase and reducing exposure when credit spreads decline.*
I found that when you combine four metrics – valuations, credit spreads, the yield curve, and the unemployment rate – you create a much more reliable countercyclical index. This makes sense because credit spreads are very sensitive to economic activity while the yield curve and unemployment rate tend to be much less sensitive. In particular, metrics like the unemployment rate evolve over longer time horizons, adding a layer of structural stability and diversity to the index. Together, these variables create a more balanced and fundamentally grounded framework.
Ahhh, but here’s the next challenge. We want the portfolio to lean aggressive at times, never too aggressive. After all, this is a behavioral portfolio and if you found yourself at 100% stocks after the market dropped in 2008, only to watch it fall another 27% in the first three months of 2009 (as it did), you haven’t managed risk – you’ve amplified it. Through your rebalancing you’ve compounded the very behavioral risks the portfolio was meant to reduce. Fortunately, the solution has already been offered. . . by Bogle himself.
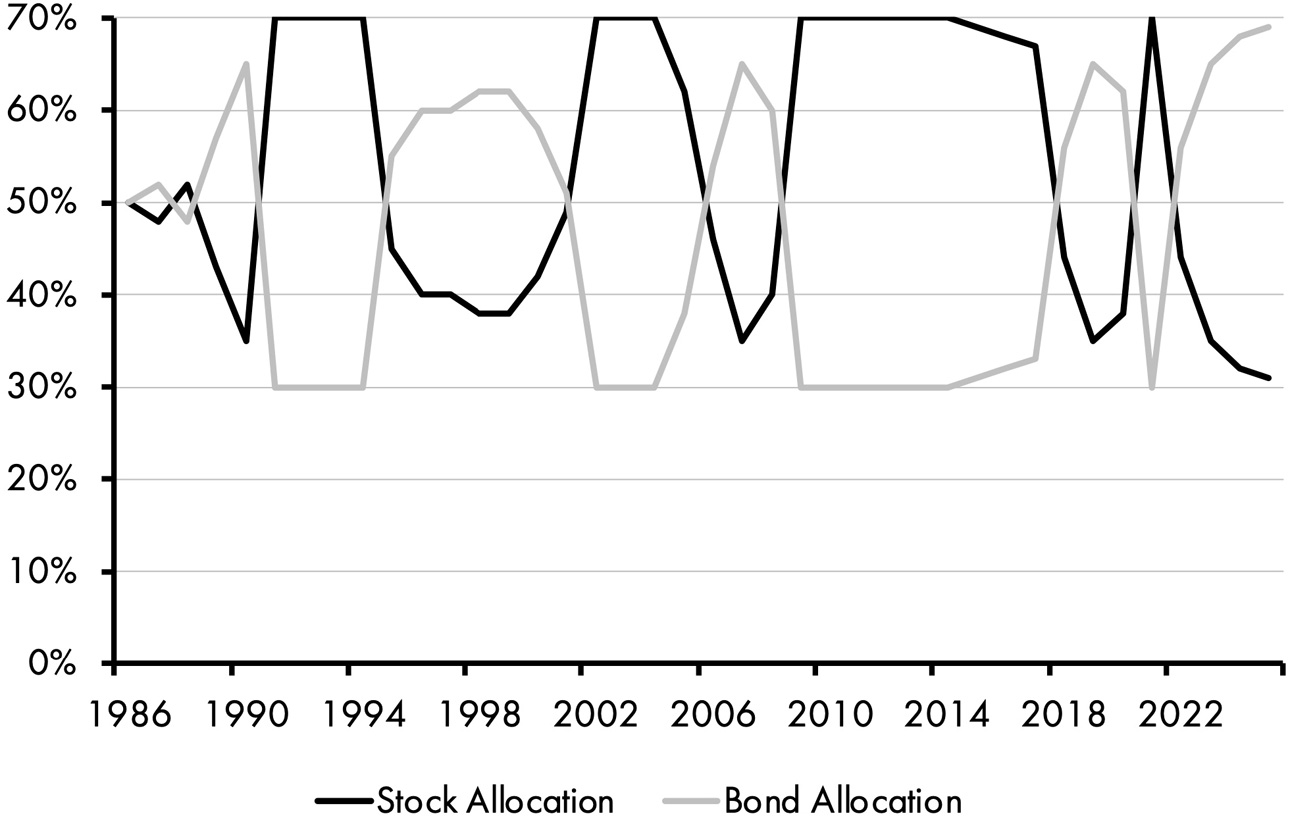
To reduce the risk of outsized stock market risk we can throttle the rebalancing process by setting boundaries – just as Bogle suggested – between 70/30 and 30/70. These bands ensure the portfolio never shifts into an excessively aggressive position. Figure 12.2 illustrates how this works in practice using my four metric index.
Figure 12.2: Four-metric countercyclical index
To build a Countercyclical Portfolio, you can use any broad stock and bond index that aligns with the signals, parameters, and allocations discussed above. I’m personally partial to using global equities and domestic fixed income within this portfolio. For example, you could build your own Countercyclical Portfolio using the following ETFs, which, as of 2025 would be weighted as shown:
- Vanguard Total Domestic Stocks (VTI): 17%
- SPDR Foreign Developed Stocks (SPDW): 12%
- Vanguard Emerging Markets Stocks (VWO): 5%
- Vanguard Short-term Government Bonds (VGSH): 30%
- Vanguard Intermediate Government Bonds (VGIT): 25%
- Vanguard Long-term Government Bonds (VGLT): 11%
This aligns with the market capitalizations of global stocks and US government bonds, but reweights the relative stock versus bond holdings to try to better control for the risks between the two asset classes. I also prefer to take the bond piece one step further and control for duration risk inside the bonds, but that’s overcomplicating things for the sake of this text.
If you’re interested in how our customized Countercyclical Index might fit into your personal strategy, feel free to reach out – I’m always happy to help others think through how to apply these concepts in a practical way.
THE COUNTERCYCLICAL PORTFOLIO ANALYSIS
I’ve always appreciated this concept as a form of multi-asset portfolio that aims to create balance, without all the complexity of something like a traditional Risk Parity strategy. It works well as a contrarian approach, designed to zig when others zag, especially at market extremes when sentiment becomes highly stretched. While it may be behaviorally difficult for many investors to increase risk during periods like 2009, this kind of allocation would have systematically tilted more aggressive at that time, shifting toward 70% stocks as valuations declined and opportunity increased.
Will this outperform something like the traditional 60/40 Portfolio? That’s hard to say, especially since its average allocation tends to hover closer to 50/50, as I’ve implemented it. However, one of its strengths is that it’s grounded in an empirically driven, contrarian framework. Unlike the 60/40 Portfolio – which offers no specific rationale for its 60% stock allocation – the Countercyclical Portfolio provides a more tangible basis for adjusting exposure. That structure can make it easier to stick with the strategy, especially when markets feel overextended or out of sync.
In terms of its hypothetical performance this one does well, especially when it matters most. The portfolio generates 5.51% average annual returns with volatility of 9.52% while the global 60/40 Portfolio generated 5.39% per year with 10.15% volatility.
Figure 12.3: Countercyclical Rebalancing Portfolio performance
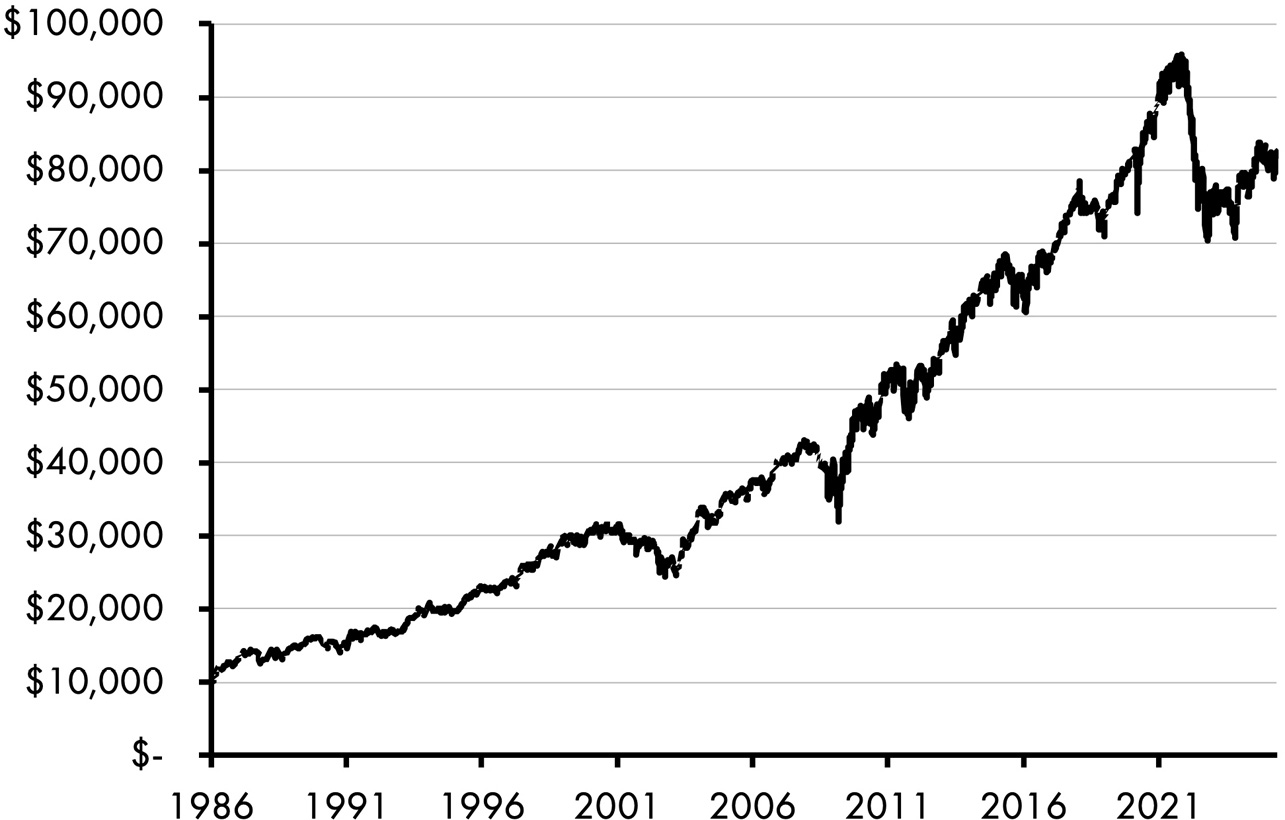
Table 12.1: Portfolio analysis
|
Countercyclical Portfolio |
Global 60/40 | |
|---|---|---|
|
Real Returns |
5.51% |
5.39% |
|
Volatility |
9.52% |
10.15% |
|
Sharpe Ratio |
0.57 |
0.53 |
|
Sortino Ratio |
0.81 |
0.76 |
|
Max Drawdown |
−25.94% |
−33.65% |
|
Ulcer Index |
8.24 |
8.65 |
|
Market Correlation |
0.41 |
0.46 |
The Ulcer Index for the Countercyclical Portfolio is 8.24, roughly similar to the global 60/40 Portfolio at 8.65. The bigger difference occurs during drawdowns, with the global 60/40 Portfolio falling 33.65% versus the max drawdown of 25.94% for the Countercyclical Portfolio.
Figure 12.4: Countercyclical Rebalancing Portfolio drawdowns
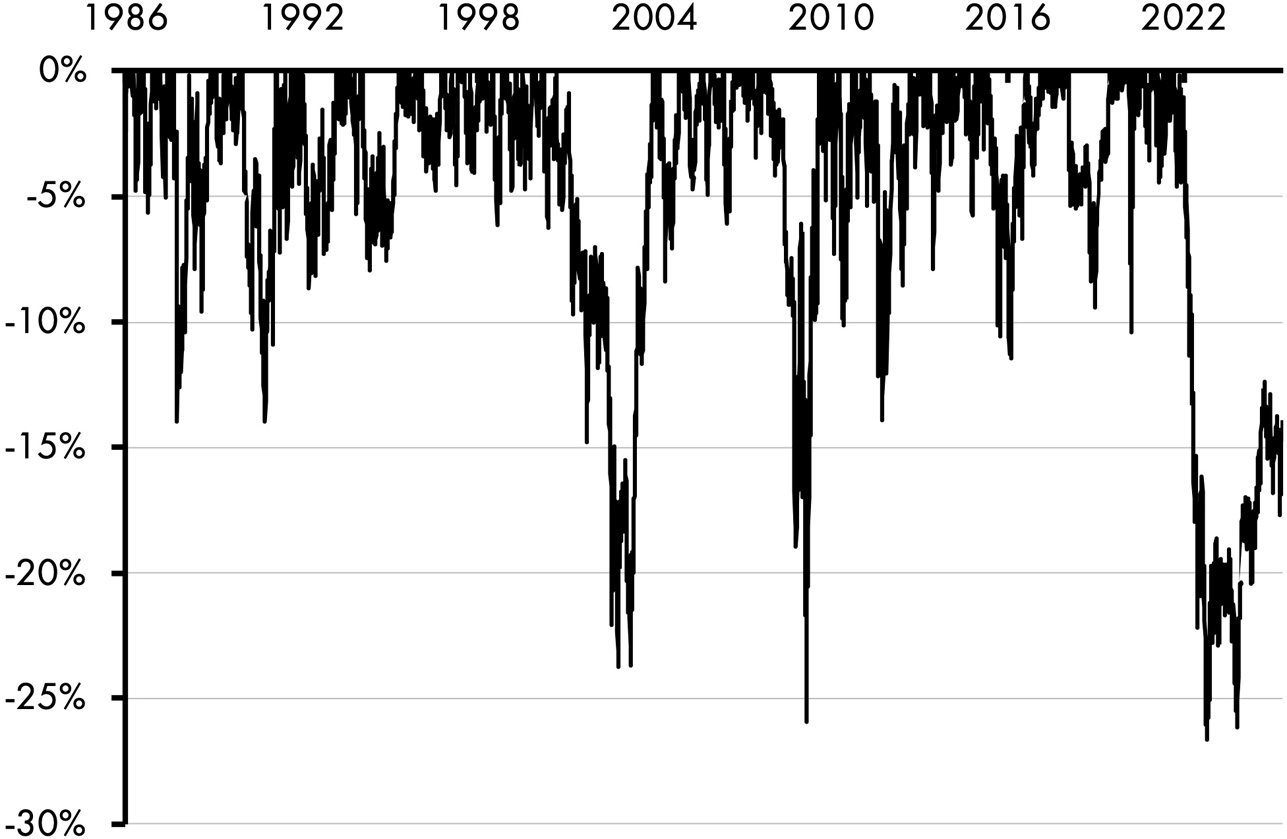
One thing to keep in mind with this portfolio is that it will likely underperform during big bull markets as you move underweight stocks, but it will often make up for it during a bear market. There are trade-offs in this approach that may or may not suit your behavior.
THE COUNTERCYCLICAL PORTFOLIO PROS AND CONS
I’m biased because I created the countercyclical index and love everything Jack Bogle ever did, but it’s not all good news on this one. Here’s the bad news:
- This is not a beat-the-market portfolio. While it’s designed to keep your behavioral biases in check, it could go through periods where you’re underweight stocks during major rallies, or overweight stocks during extended periods of negative sentiment. If you’re not a conservative investor, you could experience the wrong kind of behavioral bias from this portfolio in the form of anxiety about being left behind in a rally.
- Picking the best countercyclical metric isn’t straightforward. Procyclical indicators like valuations and credit spreads do not consistently predict market highs or lows. Incorporating additional macroeconomic variables helps make the index more consistent, but might not always be countercyclical relative to the stock market. As the old saying goes, “the stock market isn’t the economy.”
- You could incur some tax inefficiencies using this structure in a taxable account since it involves more aggressive rebalancing over time. In contrast to a simpler strategy like 60/40, you’re shifting allocations in a more pronounced way, which can trigger taxable events. That’s one reason to consider sticking with an annual rebalancing schedule.
- While this approach creates better balance than a traditional 60/40 Portfolio, it’s still limited to stocks and bonds, so you may need outside assets to achieve broader diversification. I generally calculate a 50/50 stock/bond portfolio as having a duration similar to a 10-year instrument. So, this portfolio should be viewed as having a time horizon that’s not short term, but also not especially long.
What about the good news?
- For a moderately active strategy, this portfolio is relatively easy to construct and manage – it only requires a handful of funds and a simple annual rebalancing schedule. While determining the right signals and associated allocations may take some thoughtful planning, the ongoing maintenance is straightforward. This portfolio is diverse and low-fee.
- The portfolio is designed to be behaviorally resilient, helping investors remain grounded during periods of heightened market stress. For those able to resist the pull of fear of missing out, it can provide a sense of stability – particularly during extremes like the market peaks of 1999 or the troughs of 2009, when many others may be acting irrationally.
- The portfolio aims to achieve a similar objective as Risk Parity by rebalancing in a way that helps offset the stock market’s outsized risks, especially during the most challenging periods.
- This is a great portfolio for the investor who is consistently struggling with behavioral biases and concerns about how to implement a more systematically contrarian style of allocation without succumbing to the all-in or all-out bias. Using a quantifiable and systematic approach will help you remain more disciplined by relying on data outputs instead of emotions.
SUITORS FOR THE COUNTERCYCLICAL PORTFOLIO
The Countercyclical Portfolio is best suited for conservative investors or those who tend to be more emotionally sensitive to the booms and busts of the market. It’s designed to generate more stable returns over time, even if that means accepting lower relative returns during extended bull markets.
This portfolio appeals to investors who are skeptical of complex strategies like Risk Parity but still want a more balanced approach within a straightforward stock/bond framework.
It’s also a strong fit for those who want to stay consistently invested, as it remains fully allocated to stocks and bonds at all times. However, it may not be ideal for very aggressive investors or those seeking broader diversification beyond traditional equity and fixed income asset classes.
FINAL THOUGHTS
I practically twisted my brain into a noodle designing the custom index for this portfolio. At times, I wished I had a neurologist to help me stop overthinking it. And that brings us to our next portfolio.
William Bernstein, an actual neurologist, is up next with his aptly named No-Brainer Portfolio. Bernstein is a literal genius, so you’re going to want to keep reading.