The Portfolios
Chapter 7
The Forward Cap Portfolio
I HAVE a confession. I lied about having been married to all these portfolios at some point. I know, I am a bad person. This portfolio is not one I have married, but it’s like the person I secretly dream about marrying despite being married to another (sorry, honey).*
This is a portfolio I’ve been thinking about for years, and I’m presenting it publicly here for the first time. While it’s still somewhat theoretical and untested, I believe it’s a compelling concept – grounded in solid macroeconomic principles and built on a simple, practical framework. Best of all, it can be applied using the core principles we’ve already discussed.
So, here it is. . . The Forward Cap Portfolio.
If the GFAP is the efficient market portfolio, or the portfolio that “takes what the market gives us,” then the Forward Cap Portfolio could be thought of as the portfolio that tries to “skate to where the puck is going.”
The GFAP is based on the current market cap of existing stocks and bonds, while the Forward Cap Portfolio is an estimate, based on macroeconomic trends, of what future market capitalization might look like. In other words, it’s like trying to guess what the future efficient market portfolio will look like.
I came up with this concept because this process is essentially what all entrepreneurs try to do when they invent new goods and services. Entrepreneurs do not merely accept what the economy gives them, exist within the status quo, and wait to ride the coattails of other innovators. Entrepreneurs push the envelope to develop goods and services and try to predict ways to create new markets and skate to where consumer demand is going.
The Forward Cap Portfolio does the same thing by trying to predict what the future capitalization of the capital markets will look like in the years ahead.
Let’s pull back the curtain on this sucker and see how it works.
WHY THE FORWARD CAP PORTFOLIO WORKS
I have no idea whether this portfolio works or not! We are making reasonable guesstimates about what the future might look like and the backtested data isn’t especially reliable because it’s not based on my actual estimates at the time.
Further, some people might scream that this is “active” management. Yeah, you bet your ass it is. This portfolio just so happens to strike me as a reasonable way to be active even if we can’t backtest the portfolio and analyze it the same way that we might be able to do with other market-cap-weighted portfolios.
In short, I don’t know if this portfolio will work, and it shouldn’t be used in isolation. Since it’s a pure stock portfolio, it needs to be paired with other assets to create a more complete allocation. I would never assume it’s sufficient as a standalone investment strategy. But it’s certainly useful as a component of a broader portfolio, especially in the context of a more speculative stock growth component. Then again, maybe I am not giving it enough credit. As you will see in the portfolio rationale and outline, it’s a diverse and sensible portfolio that could be appropriate as a large equity holding or even an entire equity portfolio.
Alright, enough yapping from me. Let’s dig into this one.
BUILDING YOUR OWN FORWARD CAP PORTFOLIO
The Forward Cap Portfolio is relatively straightforward to construct. We are choosing the future expected market cap allocations from macroeconomic mega trends, with the portfolio rebalanced annually to maintain those target allocations. Rebalancing is important because the portfolio has some aggressive components that could heavily skew it over time if they’re allowed to grow unbalanced.
How does this portfolio work?
I identified five major macro trends that I believe will have the greatest influence on the future composition – or “Forward Cap” – of financial markets. In theory, you could build this using many different trends, but I chose these five because they’re, in my view, the most significant and the most clearly supported by long-term empirical data.
Importantly, the portfolio does not try to own every sector or country, but instead tries to own the ones that will grow into the largest and most influential pieces of the global economy over the next 30+ years. The portfolio does not try to forecast the future stock-to-bond allocation, but instead focuses on the future market cap of equities.
How did I pick the trends that most influenced the asset allocation?
I used long-term trend analysis to build an expectations-based approach for estimating the future market caps of key areas of the global economy. These are not small trends. They are five of the most dominant mega trends shaping the world today. Here they are:
- Mega Trend #1: Technology is eating the world. Silicon Valley Venture Capitalist Marc Andreessen once said: “Technology is eating the world.” The pace of technological innovation is only gaining momentum as time goes on. Before you know it, every company in the world will be some version of a technology firm or heavily influenced by technology firms. We are still very, very early in the growth phase of technological advancement.
- Mega Trend #2: Human beings are eating the world. Humans are consuming more than ever before. Even with slowing population growth, the quantity of consumption per person is increasing. This will gain momentum as emerging markets, with their gigantic populations, evolve to more developed markets and their citizens’ wealth increases. This means two things: we will need an ever-increasing industrial footprint to meet the growing supply needs of this consumption, and we will see more discretionary consumer spending.
- Mega Trend #3: Emerging markets are eating the world. The US dollar is the world’s reserve currency today, but there’s a clear deceleration in the relative weighting of the dollar’s reserve currency status. We don’t know what country will emerge as the future reserve currency, but it’s safe to assume that the dollar’s dominance will wane, even if it’s not replaced any time soon. As this process unfolds the most likely reserve currencies will come from emerging markets where population growth will converge with technology growth to help them grow rapidly into dominant global economies. Emerging markets are likely to become developing markets that overtake older more developed economies like Europe and the US.
- Mega Trend #4: Healthcare is eating the eaters. This boom in global wealth is coinciding with the worrisome trend of an increasingly unhealthy population. We are eating more calories per person and also eating more unhealthy food, in part because we can afford to. Capitalism has done an incredible job bringing people out of poverty and increasing the wealth of the global economy, but it oftentimes creates this massive low-cost food supply with no regard for the quality of that food supply.
Figure 7.1: Percentage of people living in extreme poverty
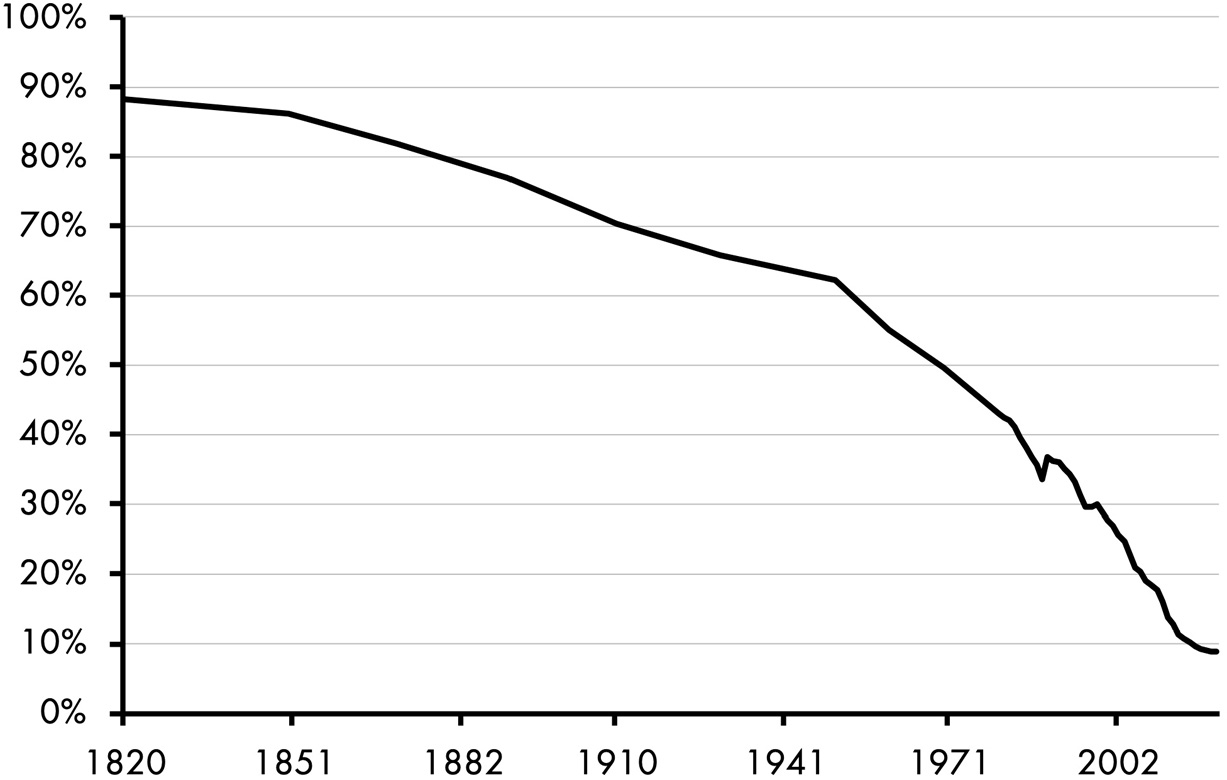
Our living standards have improved dramatically over the last 200 years, but as some problems subside others emerge. While the world is far wealthier in aggregate, this decline in poverty hasn’t been a free lunch. In fact, our vast wealth has resulted in eating too much lunch. Quite literally.
Obesity rates and chronic illnesses are on the rise, driven by increased calorie consumption and declining nutritional quality. This trend has been building for decades and may very well continue to worsen. As a result, the demand for healthcare and biotechnology is likely to grow. A wealthier global population means more people can afford quality care, but at the same time, worsening health conditions will increase the number of people who need it.
- Mega Trend #5: Decentralization is eating centralization. An interesting paradox about globalization is that as it makes the world more interconnected, it gives decentralized entities greater power. As global networks expand, individuals and small organizations can more easily access resources and scale their operations without relying on traditional, centrally located infrastructures. This means that entrepreneurship and decentralization is likely to boom over time. We’re already seeing it through the rising number of new businesses being started every year as well as the boom in personal brands. In order to succeed in the future people will become increasingly reliant on these personal brands, digital reach, and entrepreneurial growth as opposed to the old model of relying on large centralized firms to earn an income.
***
Now that we’ve established the five mega trends let’s talk about how we can use these trends to build a portfolio.
Technology is eating the world
For this tech mega trend, I took e-commerce sales as a percentage of retail sales to determine the rate at which technology is consuming the world. In 1999 this dataset was 0% and has since grown to 15% (see Figure 7.2).
Figure 7.2: E-commerce as a percentage of retail sales
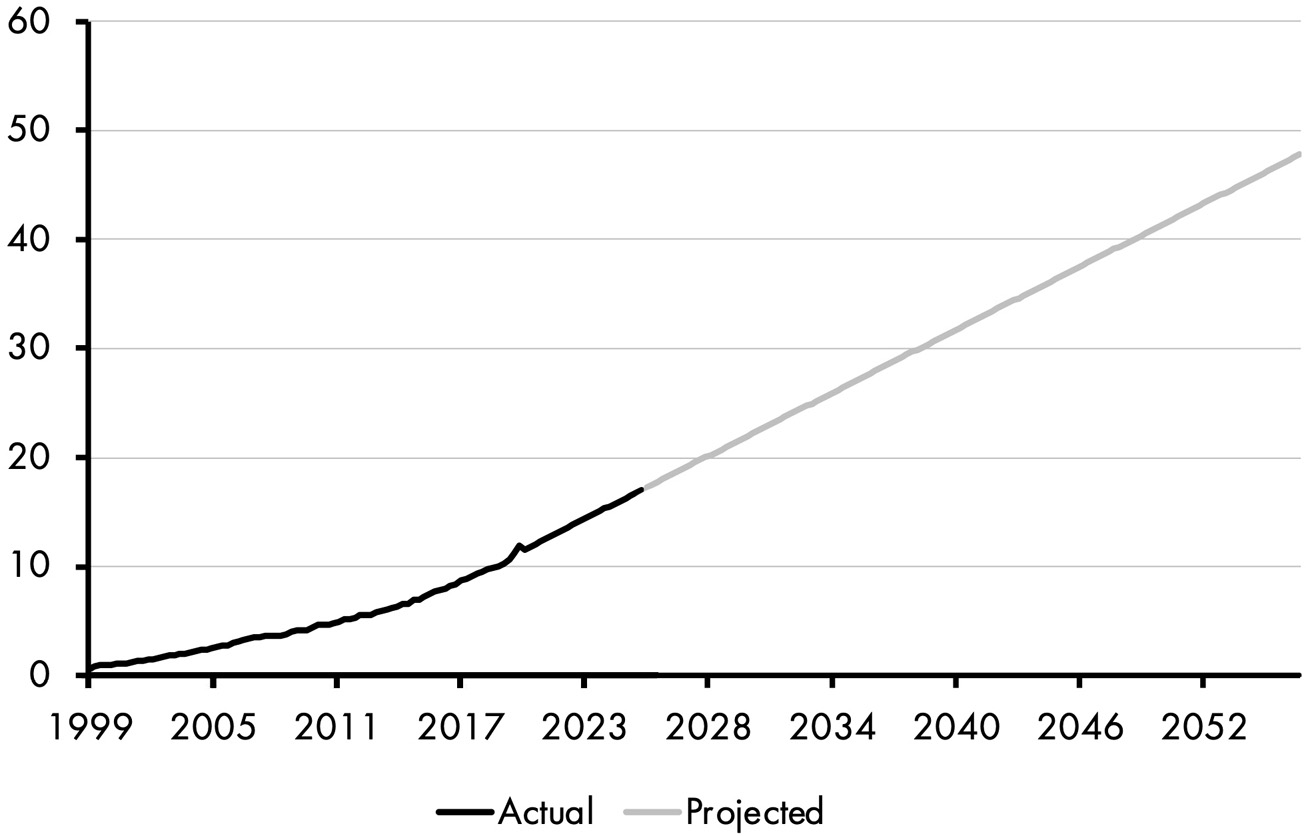
Using an extrapolative expectations projection over 30 years we can assume that this figure could be as large as 45% in 2056. Currently, technology makes up about 28% of the All World Index – so while the market recognizes tech’s influence, it likely underrepresents its long-term trajectory.
That’s why we’re setting our technology allocation closer to 40% or more, which is more in line with where we believe the world is headed. Yes, that’s a big number. But this is, without question, the most dominant and transformative trend shaping the global economy today and likely for decades to come.
While technology has been dominated by US firms in the last 20 years, we can reasonably expect this to broaden over the globe, especially as emerging markets grow and adopt the same technological needs as the developed world. To reflect this, we can apply a roughly 50/50 market-cap-weighted split for this component, allocated as follows:
WONKY MACRO SIDE NOTE
This trend has the potential to be impactful in ways that many are underestimating at present. For example, I can see a world in the next 30+ years where robotics and AI have transformed our entire economy. This is a world where robots are mass producing goods in such vast quantities that the supply overwhelms demand, leading to persistent disinflation or low inflation. The potential slowing or lowering of prices could even lead to the return of what we knew as ZIRP (zero interest rate policy) to combat sluggish price growth. Wages will slow, turnover in employment will increase and governments may respond with ever-increasing spending expansions and stimulative policies. Many of the other macro trends outlined in this book will either be shaped by this technological shift or work to amplify it.
Human beings are eating the world
As the population grows and global wealth booms, societies are likely to become more consumption-oriented. With emerging markets continuing to adopt capitalism and consumer-driven economic models, rising incomes in these regions will fuel demand for non-essential goods and services. The primary beneficiaries of this trend will be consumer discretionary companies.
In the developed world personal consumption makes up 68% of GDP. But in the major emerging markets it comprises just 47%. I expect these figures to converge on one another as the emerging market economies become wealthier with time. If this were to happen, we could see a 40%+ change in the current weighting of emerging market consumption.
Interestingly, to capitalize on this trend, we won’t just focus on emerging market or domestic consumer discretionary stocks. Instead, we want a global consumption basket. Developed-market consumers help drive growth and wealth convergence in the emerging world by buying the goods that fuel emerging market output through international trade – making this a truly symbiotic relationship.
Since consumer discretionary is about a 10% weighting at present, we’re going to re-weight our Forward Cap Portfolio at 14% and split it up over a domestic and foreign consumer discretionary allocation:
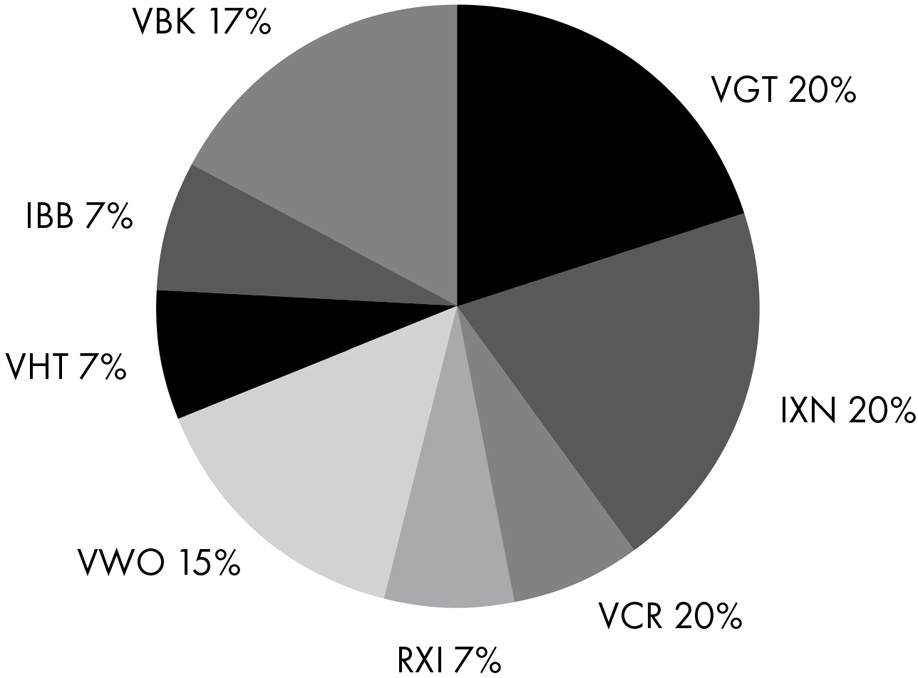
- 7% Vanguard Consumer Discretionary ETF (ticker: VCR)
- 7% iShares Foreign Consumer Discretionary ETF (ticker: RXI)
Emerging markets are eating the world
As globalization becomes a more dominant trend in the coming years, countries will become increasingly dependent on one another to achieve economic success. This is likely to result in a diversification of reliable reserve currencies. In the last 50 years we’ve begun to see the slow decline of reserve market share for the US dollar. That can best be seen in the total US dollar foreign exchange reserves held by foreign central banks, as shown in Figure 7.3.
As the dollar loses its relative importance in the global economy, the beneficiaries are likely to be the emerging economies of Asia. While there’s no clear alternative to the dollar today, it’s not unreasonable to expect that this could change over time.
Figure 7.3: USD foreign exchange reserves (%)
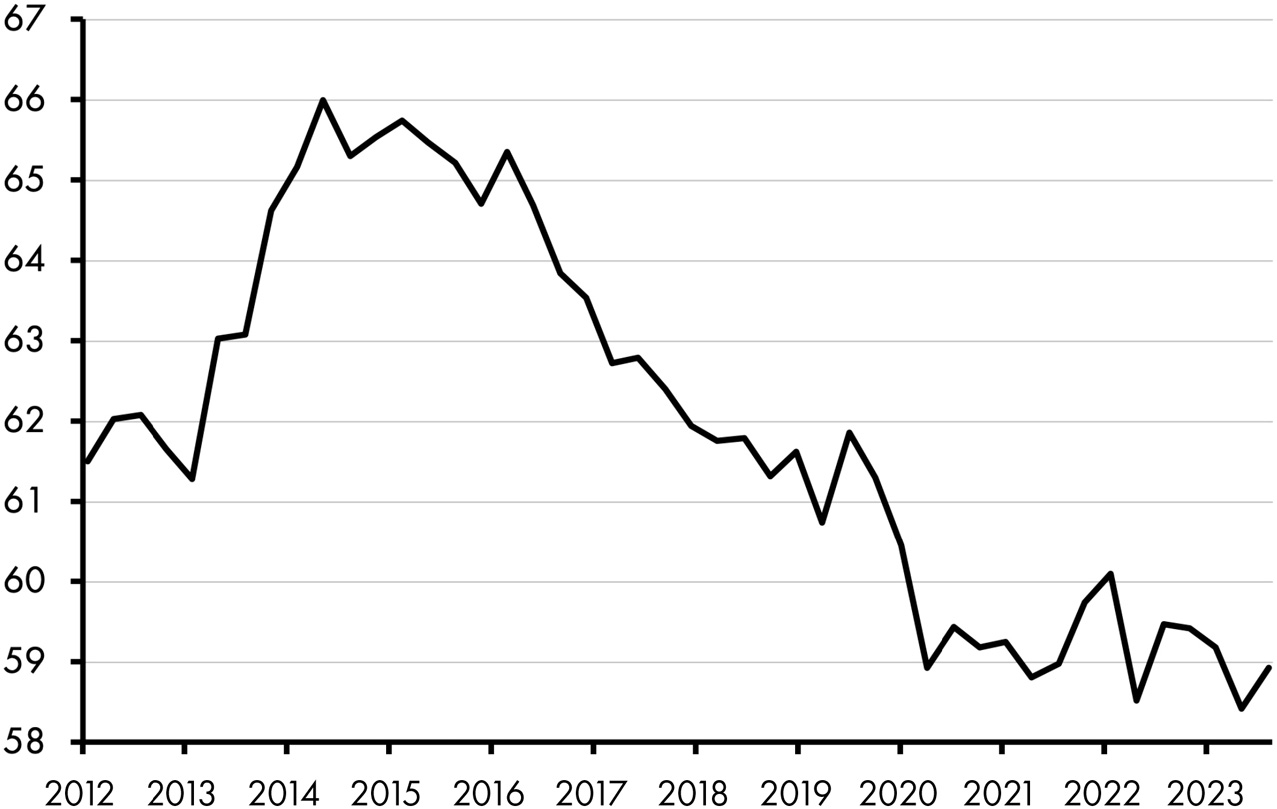
To benefit from this trend, we want to own emerging markets with the expectation that the development into a reserve currency will most benefit firms that develop within emerging markets like China and India. If the US continues to lose reserve currency share at the current trajectory it could decline to 50% with time. That shift would likely result in one or more emerging economies gaining 5–10% of the global reserve market share.
China and India are just 5% of the emerging market weight in the FTSE All World Index. A 10% increase in reserve currency share would likely lead to a similar increase in that region’s market cap weighting, as greater reserve status tends to drive capital flows, financial development, and equity market growth. Therefore, we’re going to apply a 15% weight to our emerging market holding:
- 15% Vanguard Emerging Market ETF (ticker: VWO)
Healthcare is eating the eaters
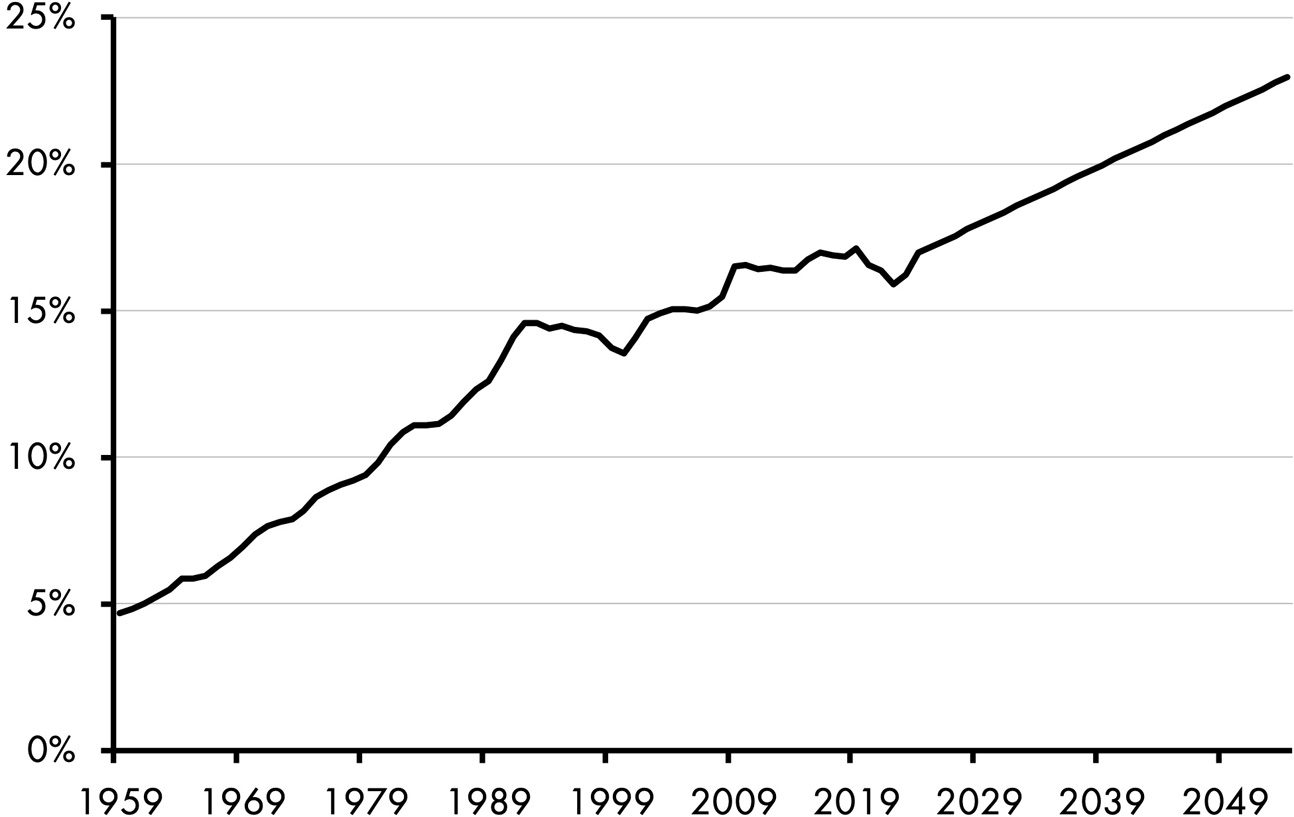
Healthcare is one of the fastest-growing components of the Personal Consumption Expenditures (PCE) Index. As global wealth increases, more people can afford better care while at the same time longer lifespans coupled with increasingly unhealthy lifestyles are driving greater demand for healthcare services. Figure 7.4 shows the upward trend in healthcare as a share of personal consumption. If this trend continues it’s not unreasonable to estimate that healthcare will increase by 40% over the next 30 years. That implies a sector weighting of 14% versus the current weight of 10%.
Figure 7.4: Healthcare as a percentage of personal consumption
To take advantage of this trend we don’t only want to own the plain vanilla healthcare index, but we’re going to want to also own the firms that are pushing the innovation curve in healthcare – biotechnology firms. To achieve our 14% weighting here we’ll split up the biotech and healthcare exposure evenly as follows:
- 7% Vanguard Healthcare ETF (ticker: VHT)
- 7% iShares Biotechnology ETF (ticker: IBB)
Decentralization is eating centralization
The world is becoming increasingly decentralized, driven by globalization and technology that make us more interconnected while simultaneously empowering smaller, more agile entities.
To reflect this shift, we don’t want to limit our exposure to the mega cap firms of the world. Instead, we want to tap into the smaller and faster growing firms that will become tomorrow’s giants. Ideally, this would be done using non-public venture capital firms, but we want this allocation to be easily accessible to more investors, so we’ll achieve this using publicly listed small cap stocks. Small caps are under-owned in total market-cap-weighted portfolios and represent just 9% of the total market. To reflect this decentralization theme, we’re roughly doubling that figure to 17% to round out our Forward Cap Portfolio using a small cap growth ETF:
- 17% Vanguard Small Cap Growth (ticker: VBK)
If you want to add an extra spicy element here, consider a small Bitcoin or blockchain ETF. But be very careful. While Bitcoin or Blockchain funds are decentralized, they’re also highly volatile so you’d want to maintain a small allocation and a consistently rebalanced position so it doesn’t create excessive portfolio skew.
In summary, Figure 7.5 shows what our Forward Cap Portfolio looks like.
Figure 7.5: The Forward Cap Portfolio
The Forward Cap Portfolio analysis
Backtests are always dangerous so it goes without saying that this backtest is not indicative of future returns. At the same time, this is also a pretty interesting perspective. Had I been smart enough to put this portfolio together 20 years ago, it would have trounced both global and US stocks (see Figure 7.6). Also, I am writing this after constructing the underlying rationale. In other words, I am not fitting the allocations to optimize the data relative to benchmarks. I constructed the model from the underlying empirical evidence and then applied it.*
Figure 7.6: Forward Cap Portfolio performance
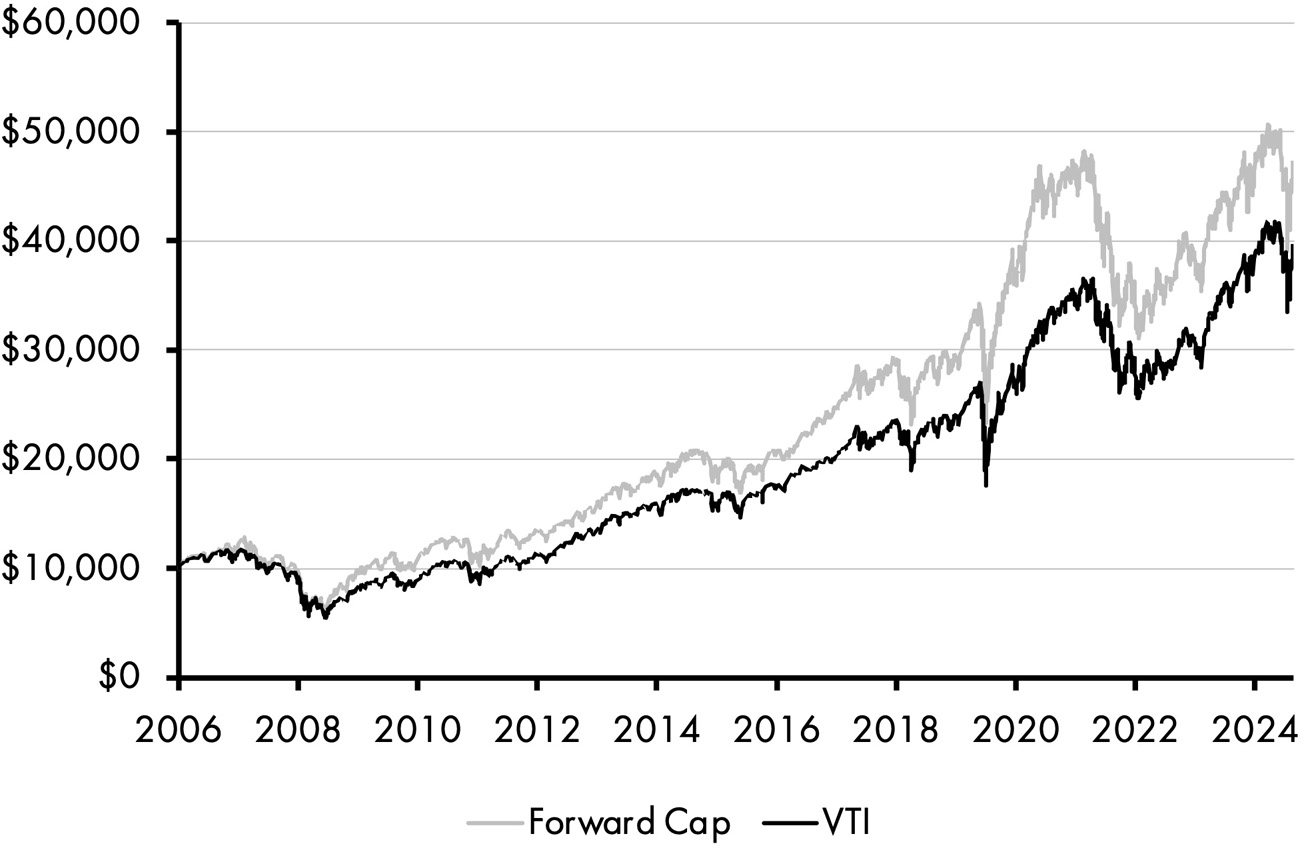
Table 7.1: Portfolio analysis
|
Forward Cap Portfolio |
US Stocks | |
|---|---|---|
Real Returns | 8.75% | 7.67% |
Volatility | 21.39% | 20.07% |
Sharpe Ratio | 0.55 | 0.52 |
Sortino Ratio | 0.76 | 0.73 |
Max Drawdown | −55.10% | −56.04% |
Ulcer Index | 14.68 | 14.95 |
Market Correlation | 1.03 | 1.00 |
The Forward Cap Portfolio would have generated 8.75% annual returns with volatility of 21.39%, compared to the US average market return of 7.67% and volatility of 20.07%. So, we’re getting more return and more risk, but the risk-adjusted returns of the Forward Cap are superior. But what’s especially interesting here is that the US market is the wrong benchmark. The Forward Cap Portfolio is a global allocation, which, in my view, makes this performance even more surprising since global stocks have been trounced by US stocks over this period.
Over this 20-year period the global stock market returned just 5.12% annually with volatility of 20.55%. The Sharpe ratios on these portfolios would be 0.55 for the Forward Cap Portfolio and just 0.40 for the global market. Perhaps more importantly, the drawdowns on the Forward Cap Portfolio were smaller than the global market and the Ulcer Index was just 14.68 compared to 17.39 for the global equity market. Frankly, I don’t think those figures can be extrapolated into the future, but it’s interesting nonetheless as these are very robust metrics.
I am obviously biased in various ways here, but this is a portfolio that I find extremely compelling for a multitude of reasons.
But let’s check our biases at the door – I am, after all, here to objectively present all the portfolios.
THE FORWARD CAP PORTFOLIO PROS AND CONS
Let’s talk about the pros and the cons here. Bad news first, of course:
- This portfolio is inherently aggressive. It will test your behavioral biases at times.
- This portfolio is “active” in nature, built on sensible guesstimates about an unknown future.
- The portfolio doesn’t capture the market cap of the entire world and is designed only to capture large mega trends. This could result in potentially significant deviations from a portfolio like the GFAP.
- The portfolio is limited to equities; you will need some other diversifiers to manage any cash-flow needs or reduce portfolio instability.
- The strategy is essentially a sector-style bet. If the selected sectors or countries underperform, you won’t benefit from the same level of diversification that a broader index fund would provide.
What about the good news?
- I created this portfolio and that means it must be good, right? RIGHT?
- Despite being just five mega trends, the Forward Cap Portfolio is extremely diverse for an all-stock portfolio. It holds over 7,000+ stocks and is diversified across large swaths of the global economy.
- The portfolio can be implemented in a very simple and low-cost manner that only requires rebalancing once a year.
SUITORS FOR THE FORWARD CAP PORTFOLIO
The Forward Cap Portfolio is best utilized by someone who wants to try to beat the market and is willing to undergo periods of significant volatility in the process of trying to achieve high long-term returns. You need a long time horizon and a high level of patience to let it work. You also need to believe that the person who created it is somewhat talented.*
The point is, it’s a full gas, no brakes type of asset allocation, so if you like a smooth and comfortable ride this is not the portfolio for you. If, on the other hand, you’re looking for a wild ride and a potentially very exciting time, then this portfolio is for you.
Well, that was an interesting one, huh? I’m not sure if it’s something you should go all-in on, but you might use it for a piece of your portfolio. One drawback of this portfolio is that it isn’t designed to weather all market environments. Given its aggressive, future-oriented outlook, it’s safe to say this portfolio will put your emotions to the test at times.
The Forward Cap Portfolio tries to beat the market by taking relatively unbalanced risk in specific sectors and economies. But what if you wanted to try to beat the market and maintain a more balanced allocation? And no, we’re not talking about 60/40 style “balance.” We’re talking about true balance. True. . . parity, you might say. Yep, Risk Parity is up next.