The Portfolios
Chapter 6
The Factor Investing Portfolio
THE GFC had a profound impact on how I view financial markets. I’d been taught that markets were efficient and rational. But in those terrifying days of 2008 and 2009, there was clearly nothing efficient or rational about what was going on. It made me wonder what the point of an “efficient market hypothesis” was other than being a cute textbook concept.
I was and am an ardent capitalist, but was confronted with the difficult economics of the biggest financial panic we’d seen in 100 years. I became convinced that the government needed to step in to help this unusually inefficient environment. While an efficient market would have corrected itself, I viewed this as a scenario where some level of discretionary government intervention in the free market made sense.
The economics of the GFC were fascinating – the private sector was suffering from what economist Richard Koo had famously coined as a “balance sheet recession.”18 This meant that the private sector had become overly indebted during the housing boom and would need to pay down debts and reduce balance sheets to become healthy again.
This is very different from a more traditional recession that is caused by a slowdown in income. The balance sheet recession was important to diagnose because these unusual recessions can turn into prolonged deflationary downturns like the Great Depression or the Japanese deflation in the 1990s.
These extreme deflations can cause a positive feedback loop as people get increasingly convinced that future prices will be lower. In these rare environments, the deflation in balance sheets becomes self-fulfilling. This puts the economy at risk of entering a deep behaviorally driven downturn. So, in my view, some active and discretionary government intervention made sense given how unusual the environment was.
At the same time, I was grappling with the idea that capitalism needs a certain amount of what economist Joseph Schumpeter famously referred to as “creative destruction” – the process by which superior companies are ultimately formed through good companies destroying weaker ones.19 While some level of government intervention can be rational and even necessary (such as setting rules and regulations) you also don’t want to overdo government intervention and create the wrong incentive structure for the private sector to compete and destroy parts of itself in the process of becoming more robust.
While I was largely convinced that low-cost passive indexing strategies were the best way for most investors to allocate assets, I also understood that there was no such thing as a truly passive portfolio. Active discretion was beneficial at times. Or, as we’ve previously noted, most investors have a practical need to deviate from the GFAP. None of us are passive because none of us operate in a perfectly efficient manner.
More importantly, I knew that the process of creative destruction requires discretionary intervention. Entrepreneurs are active investors who intervene to challenge the market’s status quo. They are the people who shape the future market capitalization of the financial assets we own. They are far from passive; they are actively disruptive. They are the creators who destroy existing paradigms in order to build better ones.
It’s become increasingly clear with time that free markets are superior to a command economy (those in which a government or central authority makes all major resource decisions), but you can believe markets are inefficient while also believing that an authoritarian economy is bad. Arguing that the market is efficient struck me as being similar to saying that the economy is efficient, and therefore discretionary intervention never made sense. But discretionary intervention is sometimes a feature, not a bug, of modern-day capitalist economies. We don’t know what the right level of discretionary intervention is (or even the optimal form), but we know that it’s sensible to a certain degree.
So, if we believe that the GFAP might not be as “efficient” as the textbooks would tell us, then how would we tilt our portfolio to take advantage of these inefficiencies?
This is the problem factor investing can help us answer. It argues that there are fundamental factors that explain a certain degree of inefficiency and outperformance.
This story begins long before the GFC. In 1964, William Sharpe (of Sharpe ratio fame) created an asset pricing model referred to as the Capital Asset Pricing Model (CAPM). CAPM assumed that risk was the primary factor driving returns and that more risk resulted in higher returns. But as time passed it became increasingly clear that the story was more complex than that, and other factors contributed to returns.
In 1992, two economics professors named Gene Fama and Ken French demonstrated that CAPM was incomplete at best and they proved that there were consistent anomalies in the CAPM. They called their asset pricing model the Three Factor Model and it revealed that size and value explained notable market anomalies. Fama and French would eventually add more factors and over the years other researchers have added their own hundreds and even thousands of factors.
In this section we’ll focus on what I would refer to as the “big five” factors:
- Size
- Value
- Momentum
- Quality
- Low volatility
Let’s go!
WHY FACTOR INVESTING WORKS
So far, we’ve focused largely on the way in which we can own “the market” portfolio and mostly plain vanilla index funds or ETFs. This is a fine approach and you’re likely to do well adhering to that strategy.
But what if you want to try to do better than the market? Are there empirically supported methods that might help you do that in a systematic manner? According to Factor Investing these anomalies could help you outperform.
Let’s dig into each one.
The size factor
This one seems rather intuitive. If you’re a small firm, then you can be nimbler and more aggressive as you try to grow into a big firm. And if you’re a big firm then you’ve already gone through your high-growth phase and now you’re more likely to operate like a big, clunky, inefficient bureaucracy. Or so the theory goes....
The evidence to support this view was once more compelling, but in recent decades, the case for small-cap outperformance has weakened. In fact, over the past 10+ years – especially in the US – it’s been the largest firms that have delivered the strongest returns.
Cliff Asness is the factor investing guru and his view is that there actually is no size effect.20 Or rather, researchers have confused a size effect for other factors. For instance, Cliff shows us that small stocks tend to have higher volatility. They don’t generate better risk-adjusted returns per se. They just take more risk. That’s your standard CAPM theory. But he has also shown that size is often confused with quality. Many small firms that outperform are not performing because they’re smaller, but because they’re higher quality.
I think Cliff has this one right. If you buy small-cap stocks, you’re likely hitching your wagon to something that will carry higher risk going forward and if you find one that outperforms on a risk-adjusted basis it’s likely that it’s just a higher quality firm. And there’s nothing wrong with that. We don’t need to quibble about Sharpe ratios and risk-adjusted returns. What we care about, after all, are real returns across specific time horizons – and if you’re willing to take on more risk in pursuit of higher returns over appropriate time horizons that’s a perfectly reasonable choice.
Size might not be the best place to go searching for alpha (risk-adjusted excess returns), but it might be a fine place to ty to earn higher returns by taking more risk.
The value factor
This is another one that seems intuitive. We want to buy things trading at a discount. Nobody likes to pay full price for stuff. Who wouldn’t love to buy a $1 bill for $0.80?
But “value” is in the eye of the beholder. While a large, mature, dividend-paying firm like the Dutch East India Company was considered beautiful over 300 years ago, today’s most admired companies are lean, tech-savvy, and often shun dividends.
Additionally, “value” is relative. When you invest in a firm that appears to be trading at a good value, you might just be investing in a company with low-growth prospects or declining quality.
Like size, the value factor has not been especially kind to investors over the last 20 years. We’ll touch on this more in the chapters ahead, but metrics like the price to book and the Cyclically Adjusted Price Earnings ratio (CAPE) have been poor predictors of short-term market performance.
This doesn’t mean value doesn’t work. It could certainly make a big comeback and factors have a tendency to come in and out of favor. Buffett was famously overweight value in the late 1990s when many investors declared his style dead. And we all know how that played out.
But my general view is that buying value most likely means you’re buying something that is a little lower risk than the market because value is often larger, safer entities that sell at lower multiples because they’re not especially high-risk entities (this of course can be wrong in the case of a “value trap”). So, the performance of value in recent decades doesn’t surprise me all that much because value is lower risk and so, probably, lower return.
Cliff Asness would say the value factor is very much alive, but that you can’t time it. I guess time will tell, but the fact is that value, like size, has not been a good alpha-generator for quite some time.
The momentum factor
Momentum is the idea that stocks that have performed well recently tend to keep performing well – at least for a while – and those that have performed poorly often continue to lag. In other words, recent winners tend to stay winners, and recent losers tend to stay losers, over short- to medium-term time frames. This pattern has shown up consistently in market data going back more than 220 years and is known as the momentum premium.21
Momentum works by measuring the cross-sectional performance of an asset relative to other, similar assets. When an asset outperforms or underperforms its peers, it’s said to exhibit a certain degree of momentum. For instance, if Google (Alphabet) is outperforming Apple over a specific period (typically measured over 12 months) it can be said to have positive relative momentum.
Some people criticize momentum as being a technical analysis-based trading strategy that has no sound theoretical underpinning, but this ignores the fact that there’s a huge amount of long-term evidence supporting this factor and momentum in price is likely to be reflected by momentum in fundamentals. In other words, firms that are performing well in the market likely have fundamental, real-world financial or operational momentum as well. You’re not just trading a trend-line on a chart. Further, theorists argue that there’s a behavioral element to momentum where prices tend to overshoot because investors often exhibit herd behavior.
One reason I’ve come to embrace the momentum factor is because I view it as quantifiable and systematic. The momentum factor doesn’t rely on predicting underlying balance sheet or income statement characteristics (even though that might explain why it works) and instead can be implemented based on pure price trends. Yes, it’s a “trading” strategy to some degree, but in the world of alpha-seeking, a pure systematic approach strikes me as a reasonable way to pursue market outperformance when compared to much more subjective underlying trends. We’ll talk about this in much greater detail in Chapter 15, Trend Following.
You’ll be shocked to learn that this one is exactly what it sounds like – owning high-quality firms. Then again, the definition of “quality” depends on how you choose to measure it. The typical definition of high quality relies on metrics such as gross margins, return on equity, return on invested capital, earnings variability, etc.
This factor is less well-supported than some of the others because it’s relatively new. But Asness is again to the rescue here and shows us that when you combine quality with something like value, the story is more compelling as quality firms selling at a reasonable price tend to also exhibit outperformance.
This doesn’t surprise me. Momentum in high-quality firms should be evident not just in their stock prices, but also in their fundamentals such as earnings and balance sheet trends. And in certain market regimes, combining quality with value can outperform pure momentum. That’s essentially what Buffett owned heading into the Nasdaq bubble in the late 1990s. By owning high-quality value, he was well positioned for a shift in the cycle in which low-quality and high-momentum names (like every tech name in the early 2000s) were likely to underperform.
The low volatility factor
The volatility factor dealt the death blow to CAPM when researchers discovered that lower volatility stocks often displayed better risk-adjusted returns than their high volatility counterparts in the long run. You didn’t get more return for more risk necessarily. In fact, you could get more return with less risk.
However, real-world applications have been less useful than the historical data led us to believe. Some researchers argue that this isn’t really its own factor, but due largely to the size factor or sector biases.
I don’t have a strong opinion, but I am skeptical of the idea that low volatility is a causal factor in leading to higher returns. So far, the real-world evidence appears to bear this out.
***
Okay, so those are our factors. You can probably guess how I would recommend mixing and matching them, but we’ll dive deeper into some different uses here so you can decide what you like.
It’s worth noting that one thing I am starting to do here is combining factors rather than highlighting their importance in solitude. For instance, value and momentum tend to be less correlated over time. This is one reason why many factor advocates argue that a portfolio of value plus momentum is the optimal way to tilt to factors. Combining factors could enhance a factor portfolio.
This, strangely, is also a compelling reason for market-cap-weighted indexing – if many factors are uncorrelated over time, then why not just try to own them all inside one clean total market package?
BUILDING YOUR OWN FACTOR INVESTING PORTFOLIO
Factor investing has become so popular over the last 50 years that there is no shortage of factor funds to choose from and for the sake of simplicity I am going to focus on the biggest and most liquid ones with a real-time track record.
The size factor can be implemented in numerous ways. One of the more well-known factor firms is Dimensional Fund Advisors (DFA), which was founded utilizing the empirical data that Fama and French created. Fama and French both serve on DFA’s Board of Directors.
One of the oldest factor funds is the US Small Cap Portfolio from DFA (ticker: DFSTX). You can also own small caps via a Vanguard fund like Vanguard Small Cap ETF (ticker: VB).
Value factor
As the most popular factor, there’s an abundance of value funds in existence. One of the oldest value factor funds is the DFA US Large Cap Value Portfolio (ticker: DFLVX). More recently iShares has created the US Value Factor ETF (ticker: VLUE) and Vanguard operates the Vanguard Value ETF (ticker: VTV).
Momentum factor
The momentum factor is newer and so it can be a bit harder to find real-time historical data based on real-world fund applications. So, we’re rather limited by what’s been in existence in the last 20 years.
AQR operates one of the older momentum funds (ticker: AMOMX) and iShares operates the US Momentum Factor ETF (ticker: MTUM).
High quality and low volatility factor
High quality and low volatility are also a bit newer and harder to find in the wild. iShares operates the US Quality Factor ETF (ticker: QUAL) as well as the iShares US Minimum Volatility Factor ETF (ticker: USMV).
***
That’s a pretty good start. There are countless other options, but these will give us a good starting point to analyze and dig into. This is one section where I leaned heavily on shorter time horizons due to actual fund availability, as opposed to using historical factor data, which doesn’t always reflect real-world performance of factors.
FACTOR INVESTING PORTFOLIO ANALYSIS
Size factor
The size factor has been a mixed performer in large part due to the outsized performance of large cap tech. While small caps outperformed from 2004 to 2015, they lagged the market from 2015 through 2025.
As seen in Figure 6.1, over this 20-year period the total US stock market generated 7.29% returns annually with 19.15% volatility, while small caps generated 6.35% returns with 22.80% volatility.
Figure 6.1: Small cap factor performance
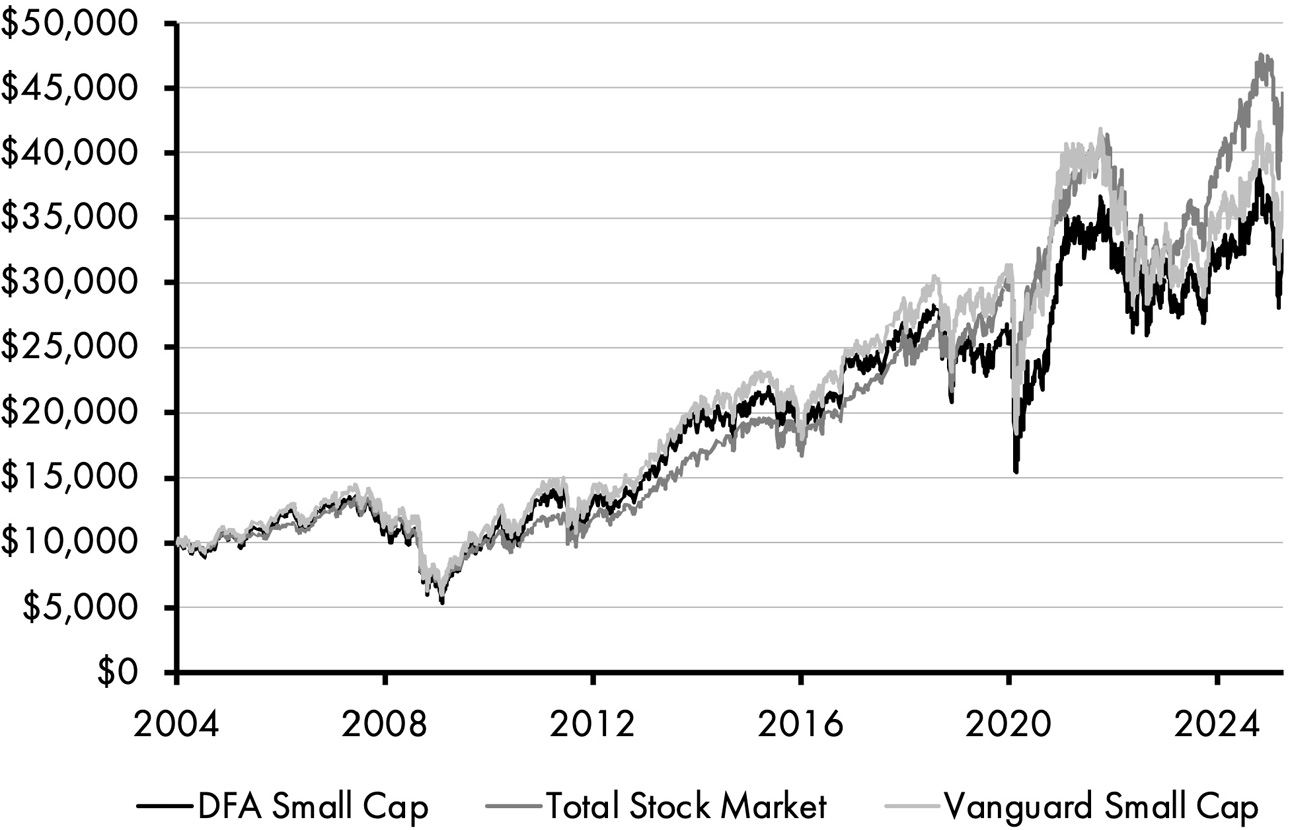
Table 6.1: Portfolio analysis
|
Small Caps |
US Stocks | |
|---|---|---|
Real Returns | 6.35% | 7.29% |
Volatility | 22.80% | 19.15% |
Sharpe Ratio | 0.43 | 0.51 |
Sortino Ratio | 0.60 | 0.75 |
Max Drawdown | −60.46% | −55.90% |
Ulcer Index | 15.14 | 14.15 |
Market Correlation | 1.10 | 1.00 |
Smalls caps have also generated less favorable risk-adjusted returns over the same period as large cap growth has dominated US stock market returns in the last decade. Figure 6.2 shows that the drawdowns in small caps and the broader market have been relatively similar across time.
Figure 6.2: Small cap factor drawdowns (%)
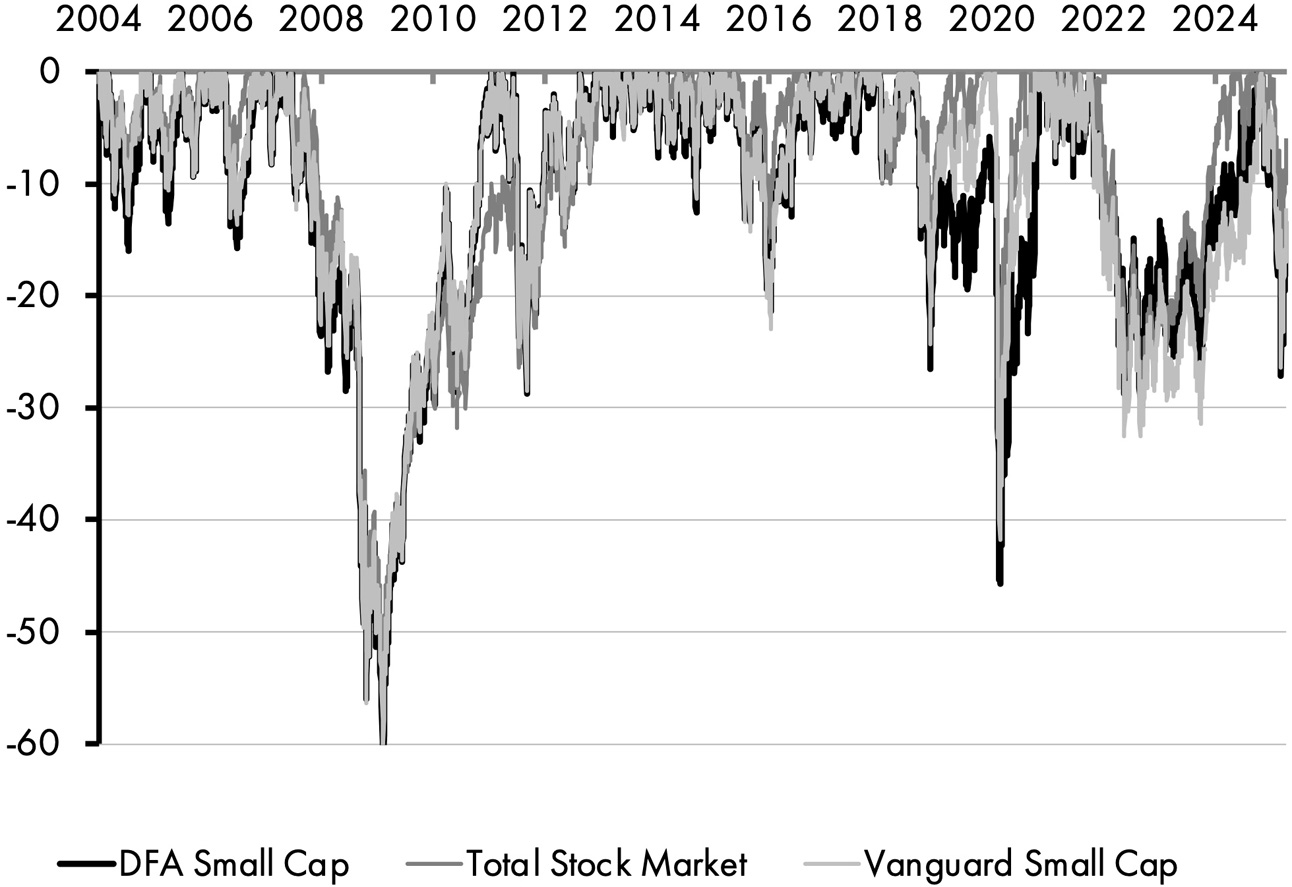
These figures are largely inconclusive in my view, and I think Cliff Asness is correct that if there is a small cap premium it’s mostly due to sheer risk across time. Which, again, is perfectly fine. There’s nothing wrong with taking more risk to generate more return; however, you probably aren’t going to get consistent alpha from the small cap factor.
Value factor
The value factor has exhibited similar characteristics to the size factor over time in that value has underperformed the broader stock market over the last 20 years, but exhibited stronger performance in the 2004–2014 period. Over the entire 20-year period value has generated 6.08% annual returns while the total market generated 7.29% returns with similar volatility. Figure 6.3 shows the extreme deviation in performance in the last five to 10 years.
Figure 6.3: Value factor performance
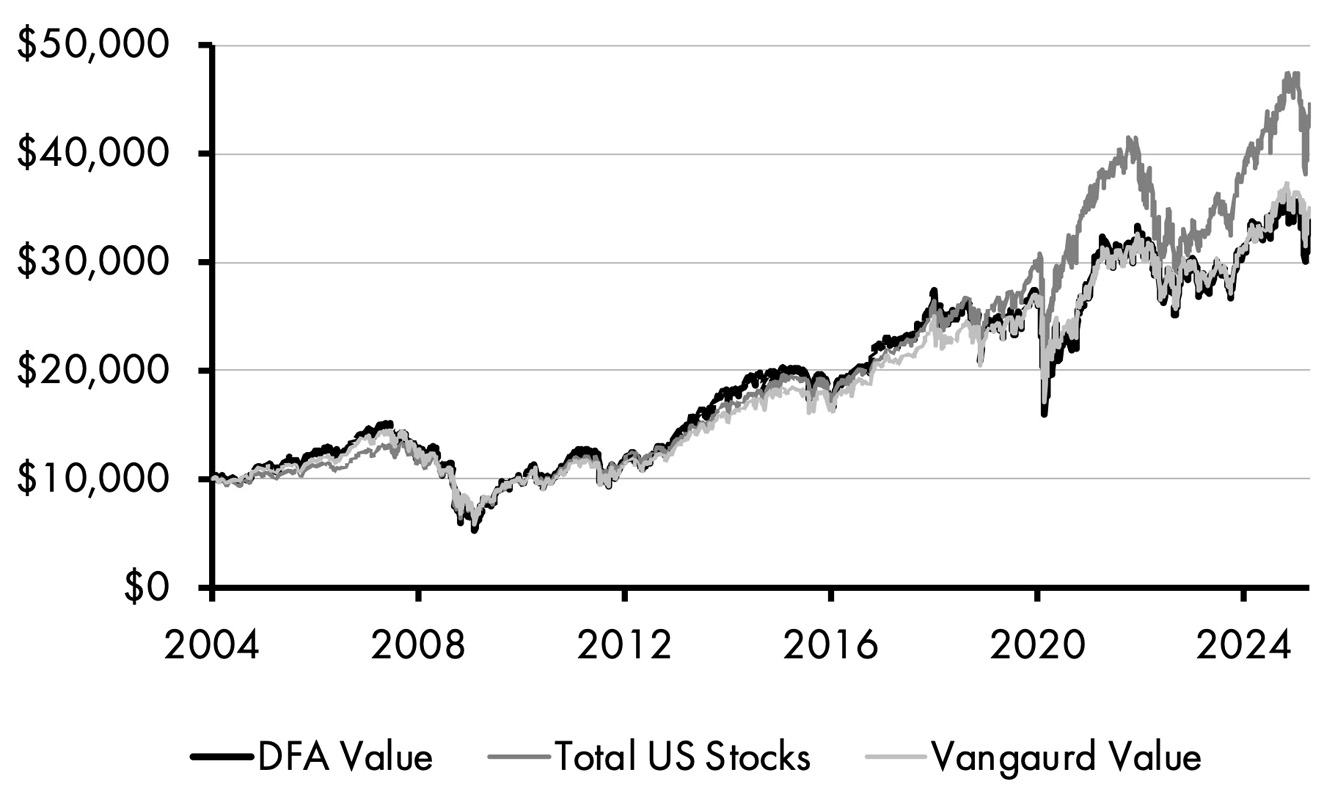
Table 6.2: Portfolio analysis
|
Value |
US Stocks | |
|---|---|---|
Real Returns | 6.08% | 7.29% |
Volatility | 19.04% | 19.15% |
Sharpe Ratio | 0.46 | 0.51 |
Sortino Ratio | 0.64 | 0.72 |
Max Drawdown | −60.15% | −55.90% |
Ulcer Index | 15.95 | 14.06 |
Market Correlation | 0.94 | 1.00 |
The story doesn’t improve when we look at risk-adjusted returns and drawdowns. Value investing generated lower risk-adjusted returns with similar volatility to the broader market over this period. It also exhibited larger drawdowns and a high Ulcer Index as seen in Figure 6.4.
Figure 6.4: Value factor drawdowns (%)
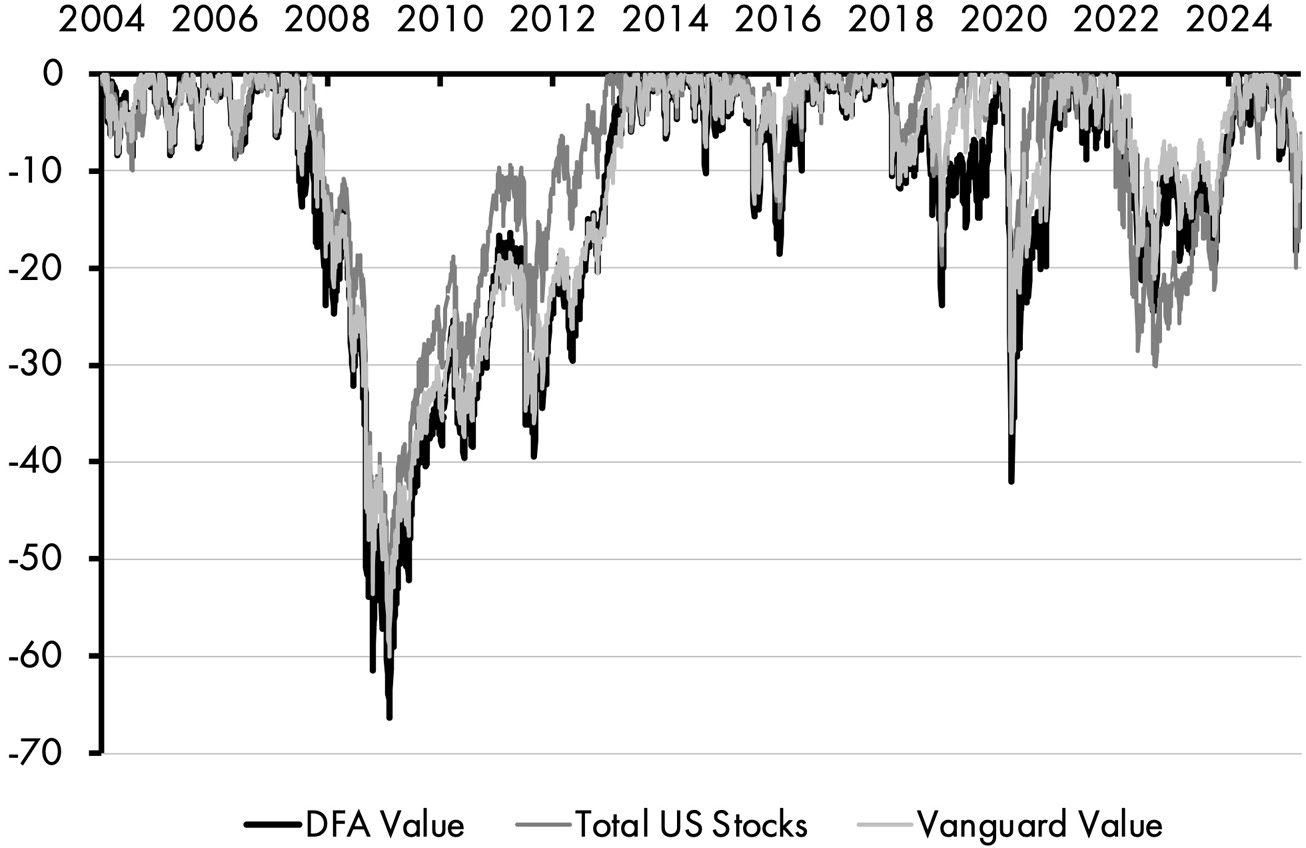
Value has been even less conclusive than size in recent decades. It’s hard to say whether value has stopped working or whether it’s in a cyclical rut. The evidence from the 2010–2025 period hasn’t been kind to value in any case though.
Momentum factor
This is where things get a lot more interesting in my view. The momentum factor has a shorter real-time track record, but the period since 2015 is one of the more telling periods for factors because the US market performance has been so disproportionate due to large cap tech performance. Despite this, the momentum factor has tracked or outperformed the broader market over the entire period. As we see in Figure 6.5, the momentum factor has held up nicely in a market that has been very difficult for most active strategies.
Figure 6.5: Momentum factor performance
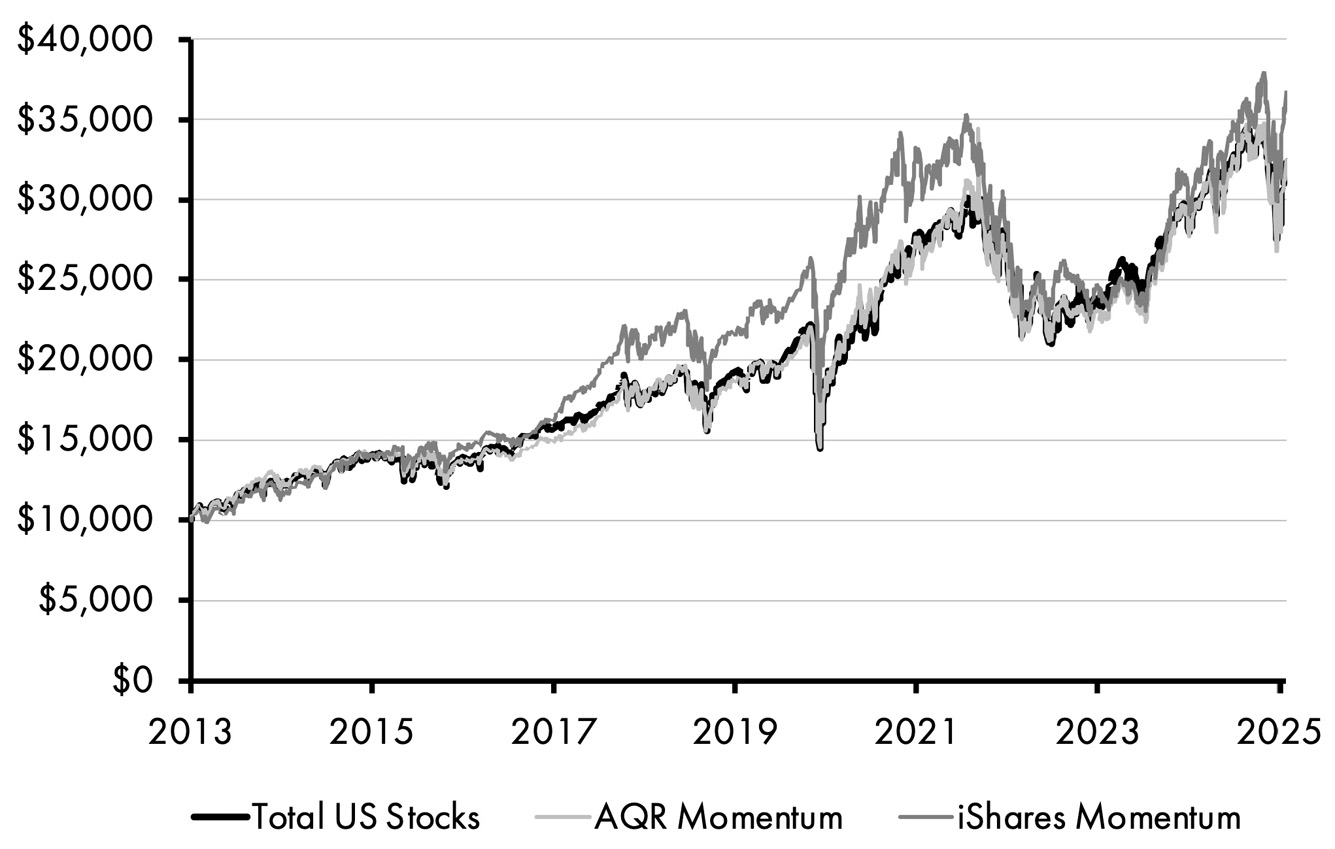
Table 6.3: Portfolio analysis
|
Momentum |
US Stocks | |
|---|---|---|
Real Returns | 11.41% | 10.68% |
Volatility | 19.75% | 17.17% |
Sharpe Ratio | 0.70 | 0.70 |
Sortino Ratio | 0.98 | 0.98 |
Max Drawdown | −36.46% | −34.54% |
Ulcer Index | 13.29 | 9.10 |
Market Correlation | 1.02 | 1.00 |
The story is slightly more ambiguous on a risk-adjusted basis as momentum had slightly larger drawdowns and more elevated volatility of 19.75%, versus 17.17% for the broader market, as seen in Figure 6.6. The Ulcer Index is also notably higher, but the US market has been so strong over this period that anything that’s come close is worth keeping an eye on.
Figure 6.6: Momentum factor drawdowns
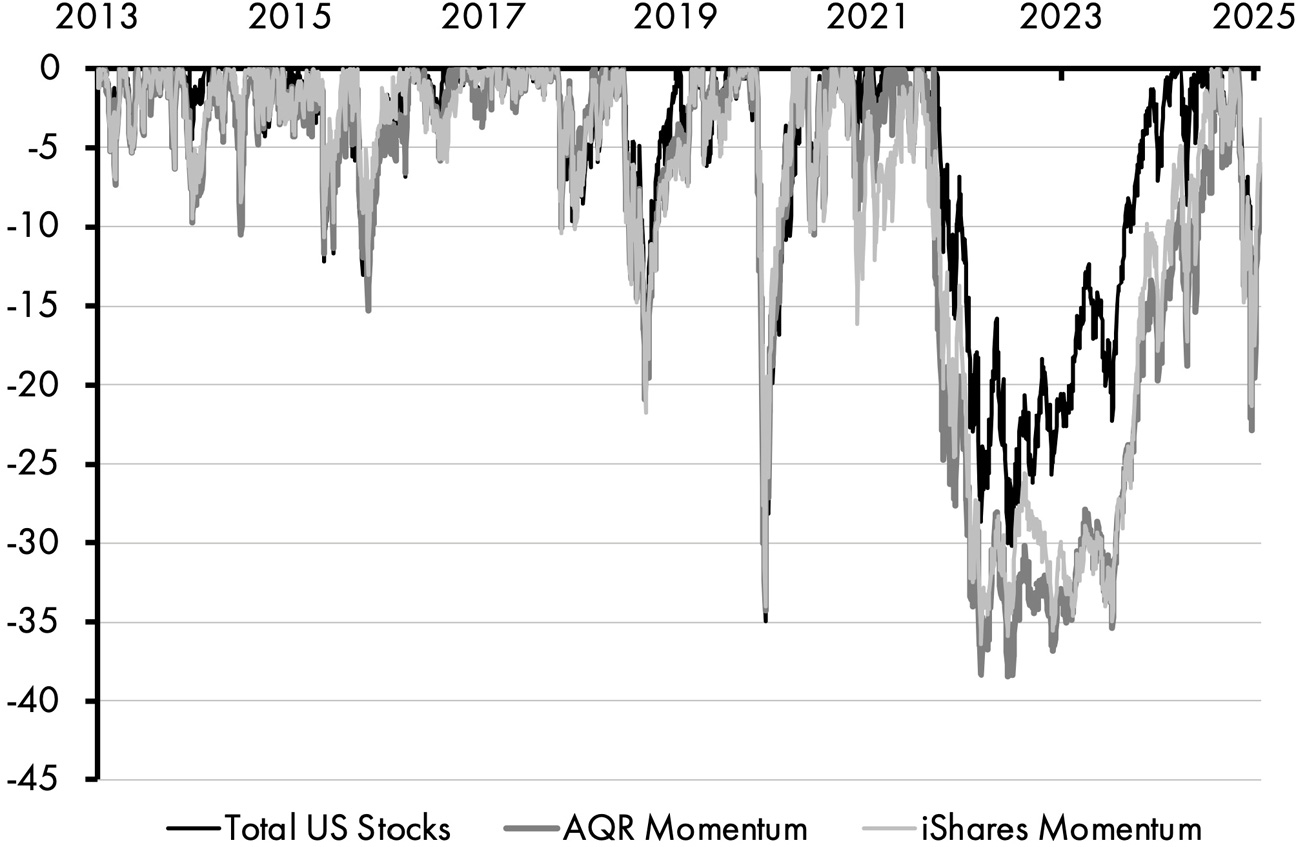
This is a more compelling factor as the outperformance over such an unusual period tells me that the momentum factor is capable of capturing a greater portion of the best-performing parts of the market, perhaps due to the more dynamic nature of the factor. In other words, momentum never constrains itself to a particular underlying set of fundamental features and can instead operate more like a multi-factor instrument.
High quality and low volatility factor
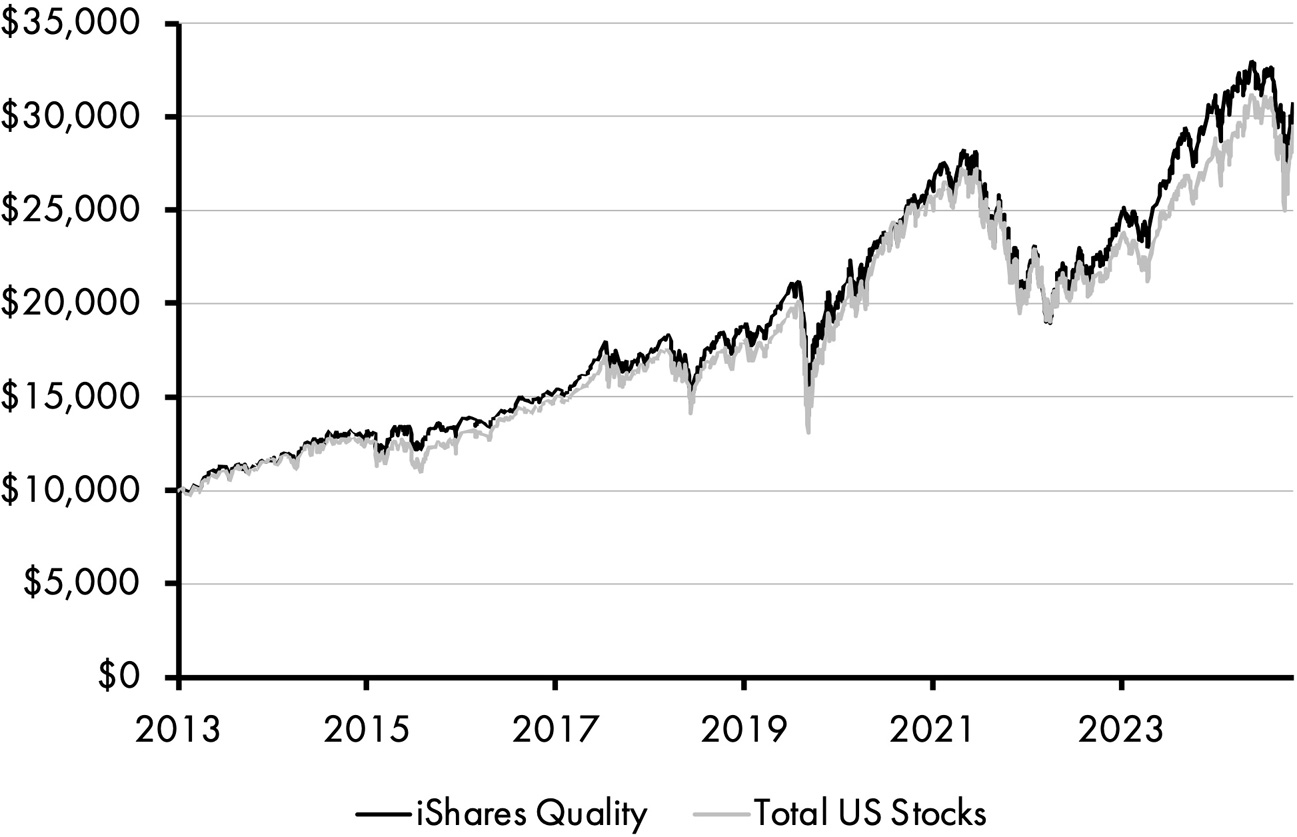
The quality factor has been another interesting one given recent performance. We again have a relatively short performance period, but the quality factor has held up well over the last 10+ years with 9.85% returns versus the total market return of 9.60%, as seen in Figure 6.7.
The factor produced volatility and risk-adjusted returns similar to those of the broader market, with a comparable Ulcer Index over the same period.
Figure 6.7: Quality factor performance
|
Quality |
US Stocks | |
|---|---|---|
|
Real Returns |
9.85% |
9.60% |
|
Volatility |
17.54% |
17.72% |
|
Sharpe Ratio |
0.69 |
0.67 |
|
Sortino Ratio |
0.98 |
0.93 |
|
Max Drawdown |
−33.69% |
−34.64% |
|
Ulcer Index |
9.18 |
9.20 |
|
Market Correlation |
1.02 |
1.00 |
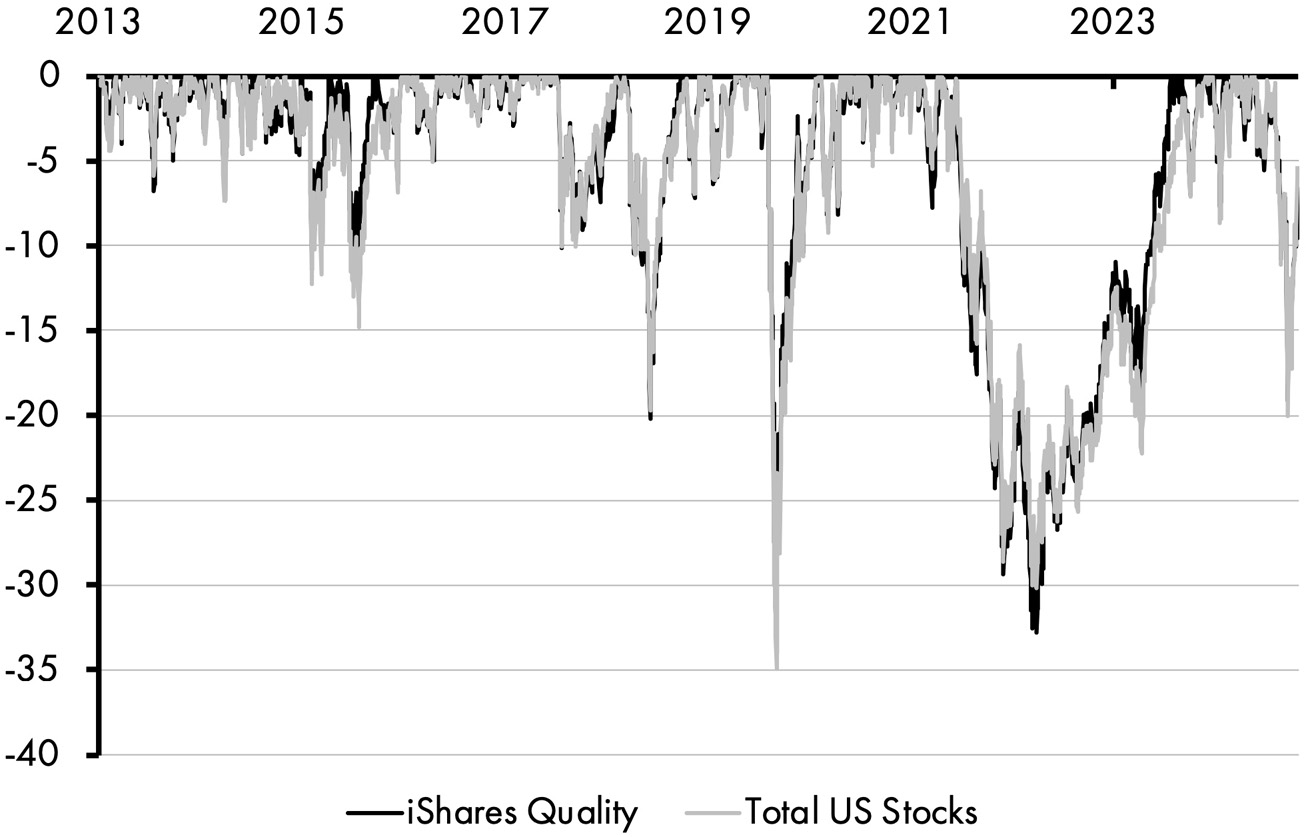
Drawdowns look very similar across this period, as seen in Figure 6.8, and like the momentum factor this one appears to capture most of and potentially more return than the total market on both a nominal and risk-adjusted basis.
Figure 6.8: Quality factor drawdowns (%)
Similar to the quality factor, the minimum volatility factor is intriguing, but the early real-time evidence of the application does not bode especially well. Since its inception in 2011, the minimum volatility ETF has been trounced by the broader market with annual returns of 9.26% versus 11.13%, as seen in Table 6.5.
Figure 6.9: Minimum volatility factor performance
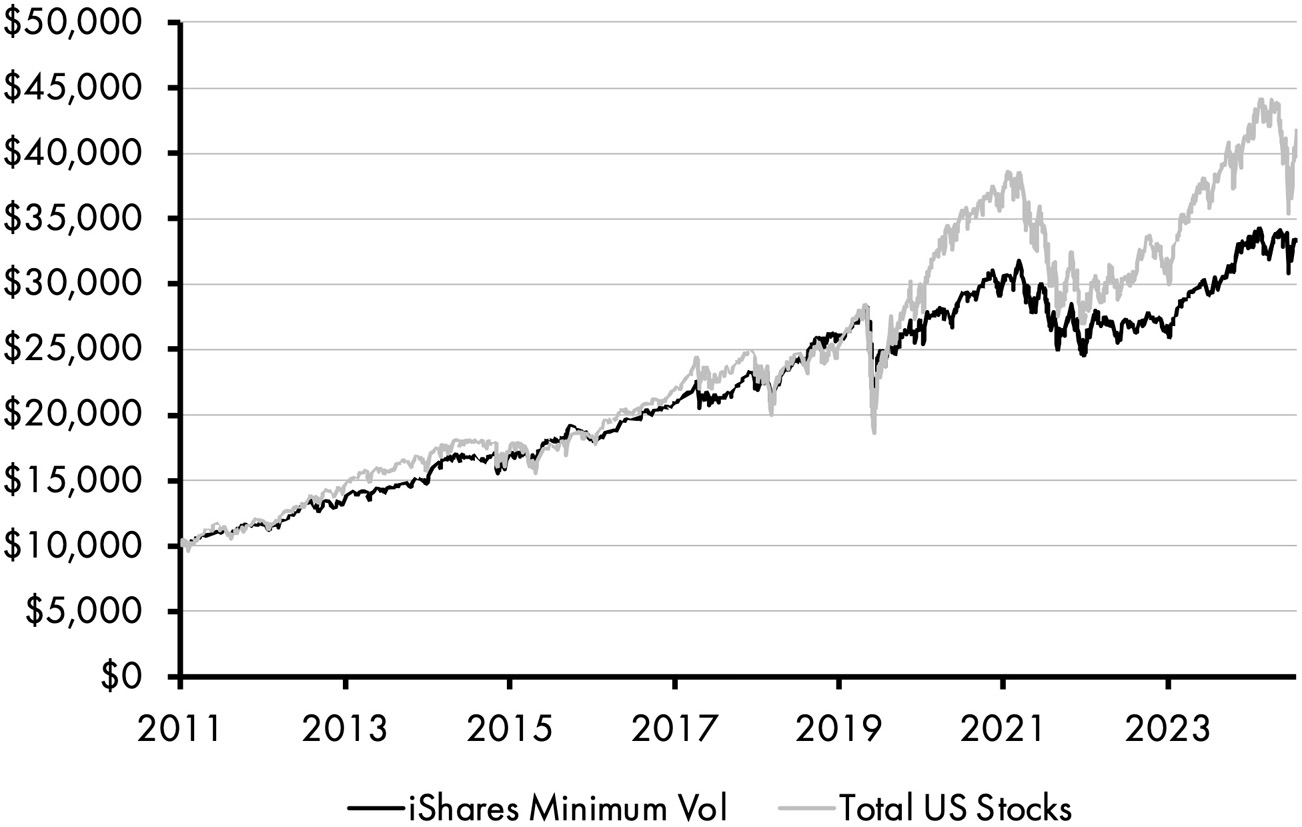
Table 6.5: Portfolio analysis
|
Min Vol |
US Stocks | |
|---|---|---|
Real Returns | 9.26% | 11.13% |
Volatility | 13.74% | 17.40% |
Sharpe Ratio | 0.80 | 0.76 |
Sortino Ratio | 1.12 | 1.07 |
Max Drawdown | -32.70% | -34.64% |
Ulcer Index | 6.82 | 8.70 |
Market Correlation | 0.73 | 1.00 |
However, the data looks much more favorable on a risk-adjusted basis. Since 2011 the minimum volatility fund was true to its name and generated volatility of just 13.74% versus the broader market’s volatility of 17.40%. As a result, its risk-adjusted returns are more comparable, with a Sharpe ratio of 0.80 versus 0.76.
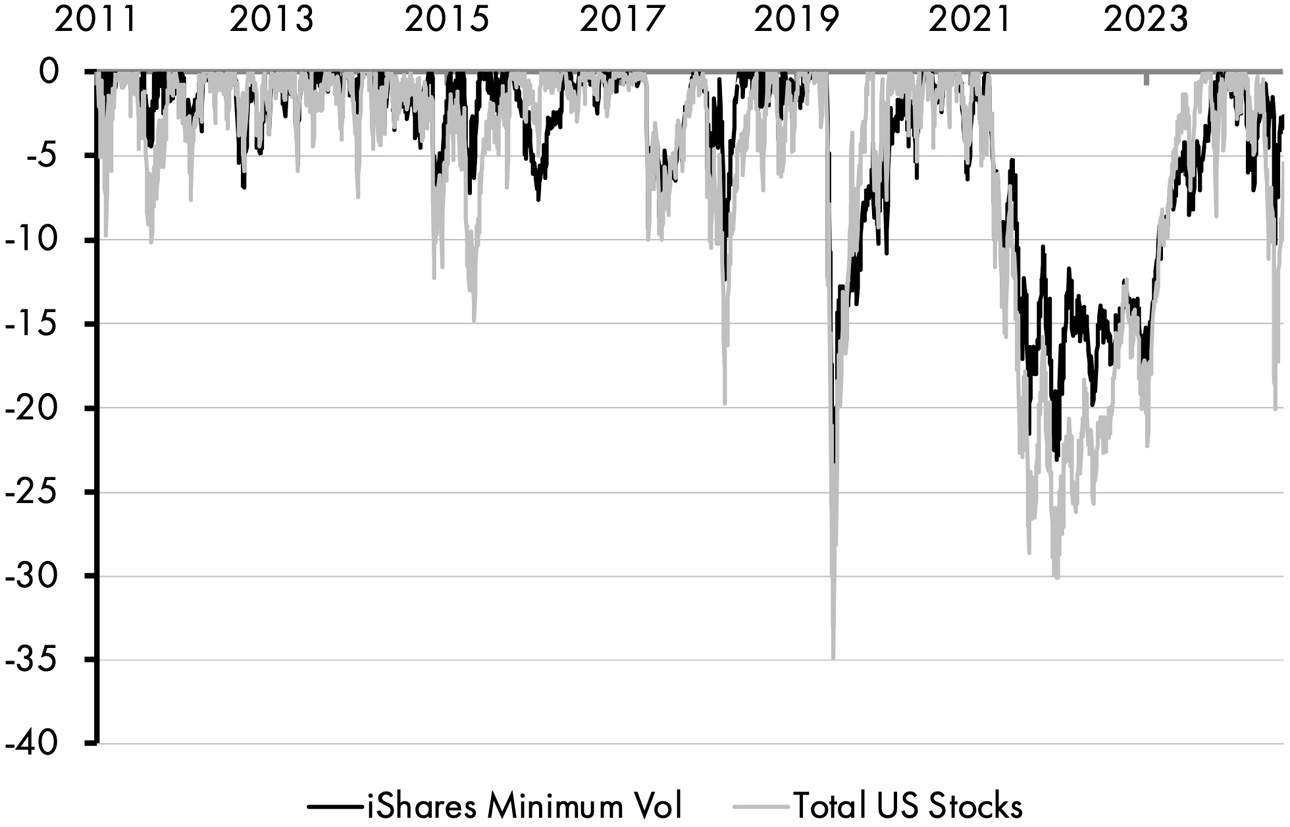
You also have smaller and shorter drawdowns with the minimum volatility factor, as well as the lowest market correlation of all the factors, as seen in Figure 6.10. So, despite its poor headline performance the story is more attractive on a risk-adjusted and uncorrelated asset class basis.
Figure 6.10: Minimum volatility factor drawdowns (%)
Combining factors
When it comes to mixing and matching the factors, things get more complex and we have to start doing some forecasting.
Based on sheer performance, the quality and momentum factors are head and shoulders above the rest. The risk-adjusted returns of a momentum plus quality portfolio are slightly superior as well.
But what if Asness is right and value, one of the most empirically supported factors, is just temporarily out of favor? In that case you might want to tilt to value with the hope that it will come back into favor in the years ahead. This is often the argument for combining value with momentum. In fact, combining value, momentum, and quality performed in-line with the broader market, but gave you superior optionality over time as the holdings are disaggregated.
How would I combine them?
As you can guess, I don’t love the entire factor farm, but I do appreciate the rigorous research behind it. And as a chicken owner, I can confirm: some farm animals are definitely better than others.
Personally, I’d use momentum and quality as a satellite in a broader allocation. If I wanted to take more risk, I’d tilt toward size. And if I wanted something a little more defensive, I’d lean into value and minimum volatility. But remember, don’t take my word as gospel.
Speaking of which, let’s be unbiased and get into some pros and cons here.
FACTOR INVESTING PORTFOLIO PROS AND CONS
This approach has a mountain of academic evidence to support it and some of the biggest names in finance utilize it. So, it’s hard to argue against.
But the factor story is still murky and I’ve struggled to get fully behind it throughout my career. That said, there are interesting and low-cost ways to mix and match certain factors even if all of them can’t be relied upon all the time.
You know the drill by now. First the bad news:
- Factor strategies rely on historical data and implicitly assume that past performance will continue. But as we’ve seen – with the value factor struggling over the past 20 years and the size factor underperforming more recently – that assumption doesn’t always hold.
- I’ve argued before that factor investing is really just another form of stock picking – except instead of selecting individual companies, you’re selecting factors based on the assumption that they’ll continue to exhibit certain performance characteristics in the future. While it’s true that some stocks have historically displayed traits like value, momentum, or quality, that doesn’t guarantee those factors will persist or behave the same way going forward. And it certainly doesn’t mean the factors you choose today will reliably deliver outperformance in the future.
- There’s reasonable evidence that you would be better off owning all the factors inside a total market ETF rather than trying to pick and time the best factors and risk owning the worst-performing factors.
- These are inherently stock-only portfolios so you will need other diversifiers as a factor portfolio is not a diversified asset allocation on its own.
And now the good news:
- As far as deviations from the GFAP go, these are all low friction. Factor investors like to refer to it as “tilting,” so you’re generally making small shifts hoping to generate a small premium in the process. These can all be implemented in a low-cost and tax-efficient manner and you’re not at risk of getting chewed up by insanely high fees in the process of trying to beat the market.
- There’s a lot of empirical evidence to support these approaches even if some of them have come under question in the last five to 10 years.
- I find the momentum and quality factors especially intriguing. The momentum factor is the one factor that I would refer to as individually dynamic in that any of the particular style factors could end up having momentum. It doesn’t constrain you to a specific style, but instead just looks at the pure price movement. As far as active management goes, this strikes me as an eminently sensible way to be more active in something like a very aggressive stock portfolio. The fact that it has fundamental and behavioral underpinnings also makes it more compelling.
- I don’t think there’s anything wrong with low-cost factor tilting, even if you don’t end up beating the market. It is perfectly fine to tilt to something like size or value, especially if you know it might mean you’re taking more risk in the pursuit of generating a higher return.
- The factor story is more convincing when we mix and match the factors. For example, mixing momentum with value or quality is a way to generate potentially superior risk-adjusted returns.
- You can also apply factor investing through a behavioral lens using risk profiling. For example, we know that factors like small cap growth and momentum tend to exhibit a little more volatility on average when compared to quality, low volatility, and value factors. In a behavioral framework, a more conservative investor might tilt toward the lower-volatility factors, while a more aggressive investor might lean into the higher-volatility ones.
SUITORS FOR FACTOR INVESTING PORTFOLIOS
Anyone who owns stocks should study and understand factor investing. But it’s best suited for the investor who wants to try to earn a bit of a premium and understands the potential risks there.
In short, this can be applied to any portfolio that holds stocks, even an indexing strategy. But it’s particularly appropriate for investors willing to make modest tilts in pursuit of higher returns, with the understanding that these tilts may not always produce the market beating returns the academic research claims to find.
As I mentioned in Chapter 1, this might be an appealing approach for someone using the Buffett Portfolio as you could use that 90% component to tilt to certain factors that Buffett likes such as value and quality.
FINAL THOUGHTS
Factor investing gives you a little taste of potentially beating the market. But what if you wanted to try to beat the market by a lot? Or invest in what the market is likely to become? Yes, that’s very active, and yes, that’s potentially very attractive
Behind Door #7 is the Forward Cap Portfolio. This one’s different from the more well-established portfolios we’ve already covered so keep reading unless you hate interesting stuff.