The Portfolios
Chapter 8
The Risk Parity Portfolio
IN August of 1971 Richard Nixon changed the fiat monetary system forever when he removed the US from the gold standard (an event referred to as the “Nixon Shock”). On that hot summer day, a young clerk at the New York Stock Exchange excitedly waited for the market to open expecting a market crash.
But the exact opposite happened and stocks surged 3.8%. This was the moment that the young man, named Ray Dalio, recognized the extreme unpredictability of the financial system as well as the need to develop an understanding of what he would famously call “the economic machine.”22
Dalio went on to start Bridgewater Associates, the largest hedge fund in the world. And the strategy he became famous for developing was called the Risk Parity strategy.
Speaking of the “economic machine” – I would recommend that you seek out Dalio’s popular YouTube video called “Understanding the Economic Machine.” It’s only 30 minutes long and does a very nice job of explaining the monetary system at a high level. If you want a nice complement to that video, you might consider reading a paper called “Understanding the Modern Monetary System” by a gentleman named Cullen Roche. It might be the greatest paper ever written, but that’s just my independent and obviously unbiased opinion. Sorry for that commercial break. Now back to the chapter at hand. . .
WHY THE RISK PARITY PORTFOLIO WORKS
Risk Parity is a smart approach to portfolio construction that focuses on where the actual risks lie within your asset allocation.
As we mentioned in Chapter 4, the risks in a portfolio like the 60/40 Portfolio aren’t proportional to its allocation. The 40% invested in bonds typically carries much less volatility and principal risk than the 60% invested in stocks. That means, while it may look balanced on paper, the portfolio behaves more like an 85/15 allocation in terms of risk – with stocks driving most of the volatility.
Risk Parity aims to balance a portfolio by equalizing the amount of risk each asset class contributes – not just the dollar amount invested. While a traditional 60/40 Portfolio ends up with most of its risk concentrated in equities, Risk Parity strategies adjust for this imbalance, often by increasing exposure to lower-risk assets like bonds (sometimes using leverage) so that each piece of the portfolio plays a more equal role in driving overall volatility. The result is a more diversified risk exposure, with the goal of producing steadier returns and better risk-adjusted performance over time. Looking at many of the various asset classes based on expected returns and risk, we can reasonably formulate an understanding of their relationships, as shown in Figure 8.1.
Figure 8.1: Traditional expected return versus expected risk
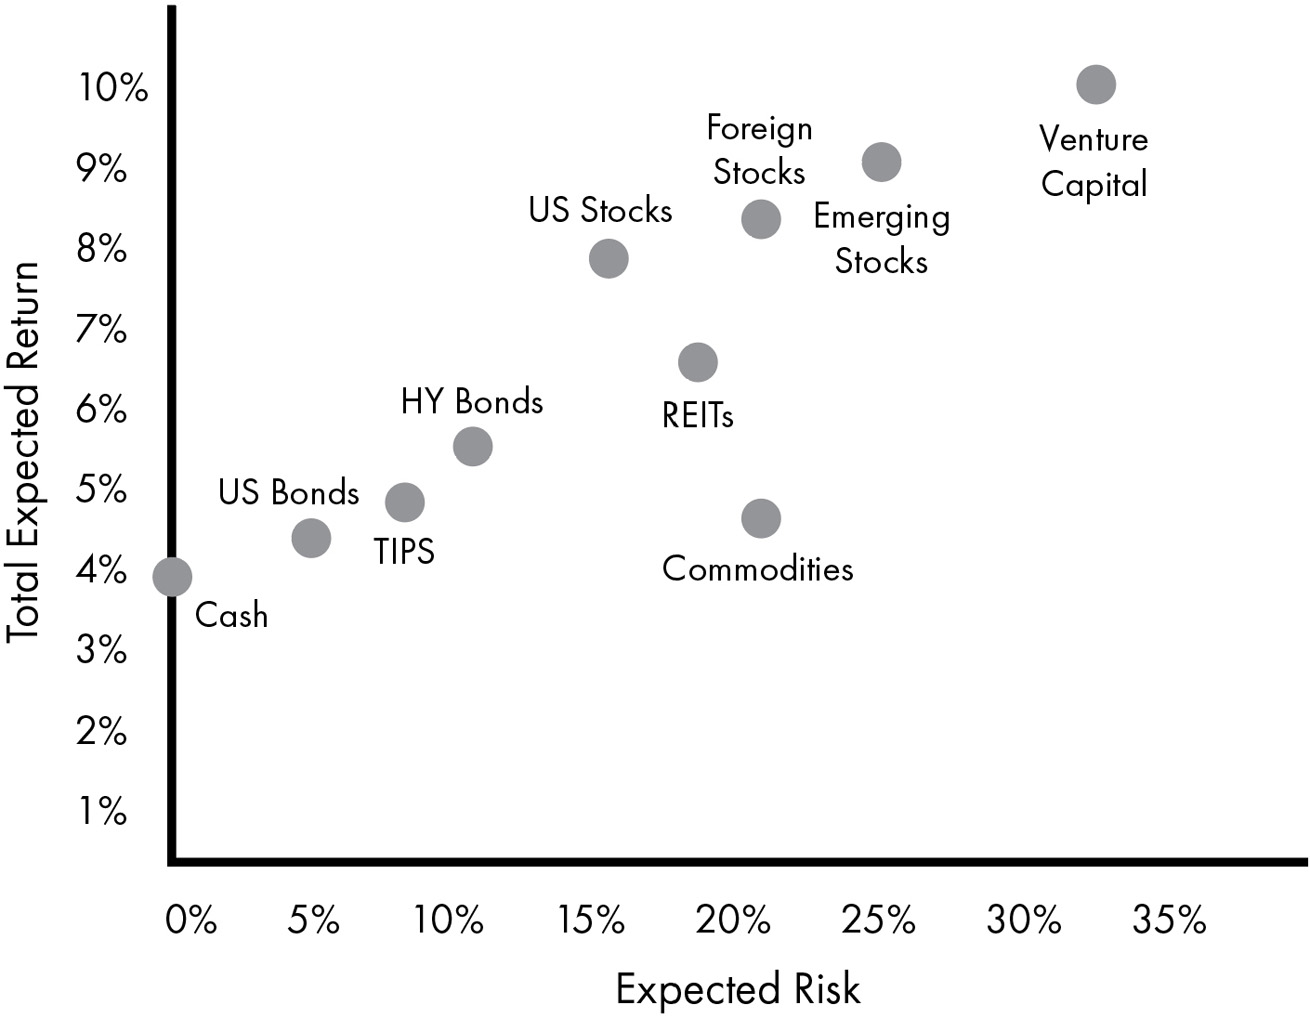
If we want to create parity across the risks in a portfolio holding these assets then we need to somehow balance the risk exposures – either by owning smaller relative amounts of the high-risk assets, or leveraging the amount of the lower-risk assets.
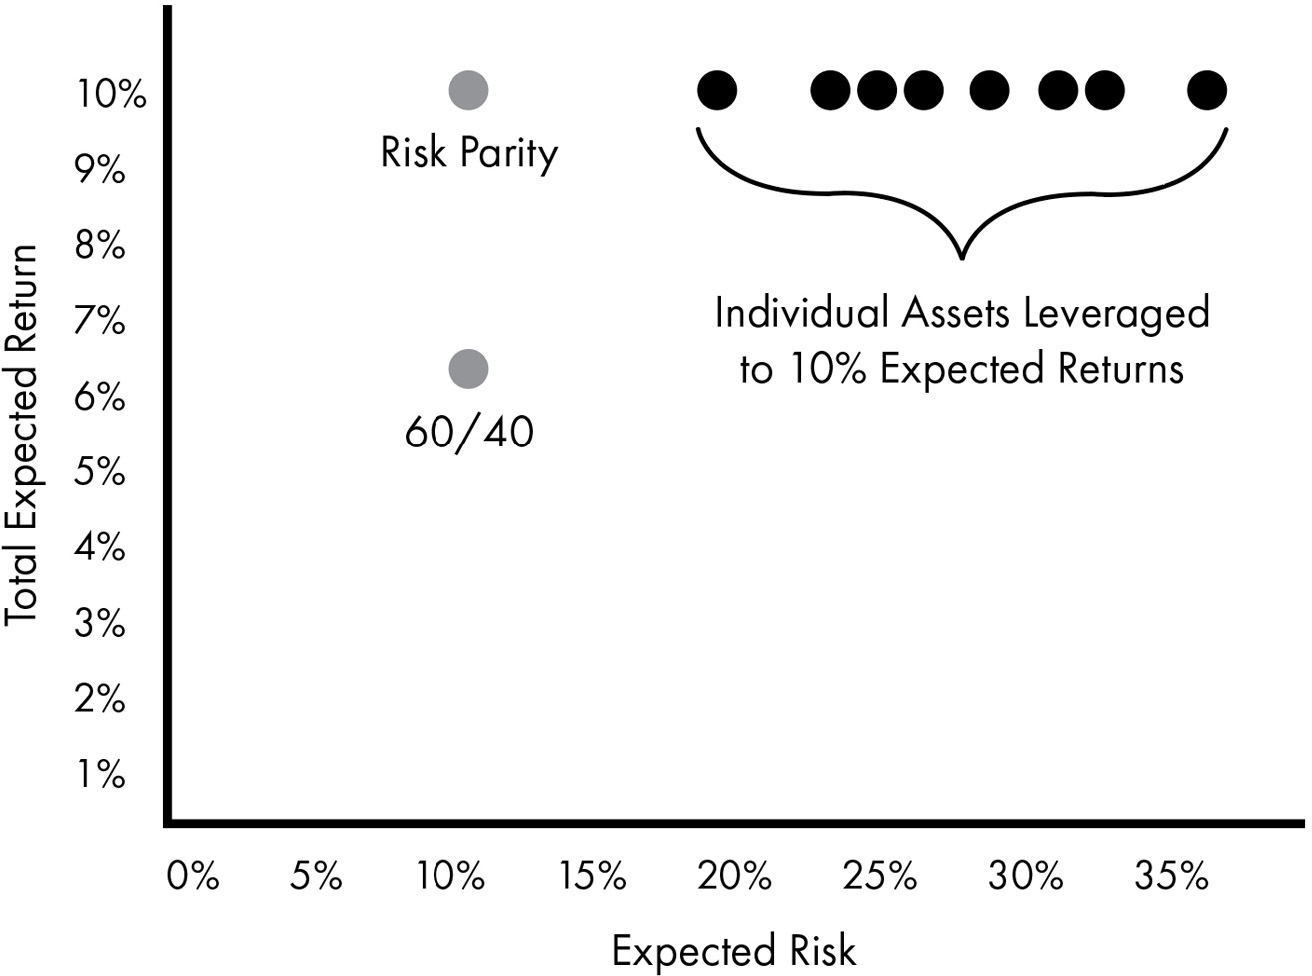
For instance, if stocks have a standard deviation of 15 and bonds have a standard deviation of 5, then you could create risk parity by leveraging the bonds in your portfolio to create equal exposures to risk inside of both asset classes. The goal is to leverage the risks with the hope that you’re creating more balanced expected returns, thereby resulting in superior risk-adjusted returns relative to something like the 60/40 Portfolio. As we can see in Figure 8.2, Risk Parity attempts to equalize the risks across different asset classes with the goal of creating a more diversified and uncorrelated set of return streams that achieve higher expected returns with a level of risk that is more consistent with a diversified portfolio like 60/40 stocks/bonds.
Figure 8.2: Risk Parity-targeted return with optimal risk
Further, Risk Parity argues that the stock and bond markets are not sufficiently diversified to weather all environments, especially recessions and inflations. Therefore, even though a Risk Parity Portfolio might underperform during periods like large stock market booms, it could outperform in outlier environments like high inflations and recessions, therefore helping to capture most of the expansionary upsides while also reducing the volatility of the most uncertain types of environments.
This “works” for the right investor who seeks broader diversification than a 60/40 Portfolio and one who has the patience to undergo periods of FOMO (fear of missing out) where stocks are surging relative to alternative assets like commodities, which often undergo long periods of negative or poor relative performance.
In my view these kinds of diverse strategies work because while they’re likely to generate lower expected returns, they will also generate lower volatility due to broader risk distribution. This means you’re unlikely to get better nominal returns, but the added diversification gives you the potential for much better risk-adjusted returns.
BUILDING YOUR OWN RISK PARITY PORTFOLIO
Building your own Risk Parity Portfolio is not easy. Dalio has stated that you would want at least 15 different uncorrelated “return drivers” to create a sufficiently diversified portfolio for this strategy.23
Building a Risk Parity Portfolio requires evaluating expected risks and returns, and deciding whether or how to use leverage to construct a balanced portfolio. As you might imagine, this can quickly become a complex task. This is especially magnified by the fact that borrowing costs can vary and eat into the cost of the portfolio.
To give you a simple example of how we might balance the risks in a portfolio using 15 uncorrelated assets, we might take the following instruments with the following standard deviations:
- US stocks (ticker: VTI): 18%
- Foreign stocks (ticker: VXUS): 18%
- Gold (ticker: IAU): 18%
- Silver (ticker: SLV): 31%
- Bitcoin (ticker: IBIT): 87%
- Long US Treasury bonds (ticker: VGLT): 15%
- Foreign bonds (ticker: BNDX): 5%
- High-yield bonds (ticker: HYG): 11%
- REITs (ticker: VNQ): 30%
- TIPS (ticker: TIP): 6%
- Managed futures (ticker: CTA): 13%
- Minimum vol stocks (ticker: USMV): 15%
- Currency carry (ticker: CCRV): 19%
- Out of the money tail risk (ticker: CAOS): 4%
- Commodities (ticker: PDBC): 18%
If we weight these in a portfolio to balance the risks we’d implement the following weightings:
- US stocks: 4.38%
- Foreign stocks: 4.38%
- Gold: 4.38%
- Silver: 2.54%
- Bitcoin: 0.91%
- Long US Treasury bonds: 5.25%
- Foreign bonds: 15.75%
- High-yield bonds: 7.16%
- REITs: 2.63%
- TIPS: 13.13%
- Managed futures: 6.06%
- Minimum vol stocks: 5.25%
- Commodity carry: 4.14%
- Out of the money tail risk: 19.69%
- Commodities: 4.38%
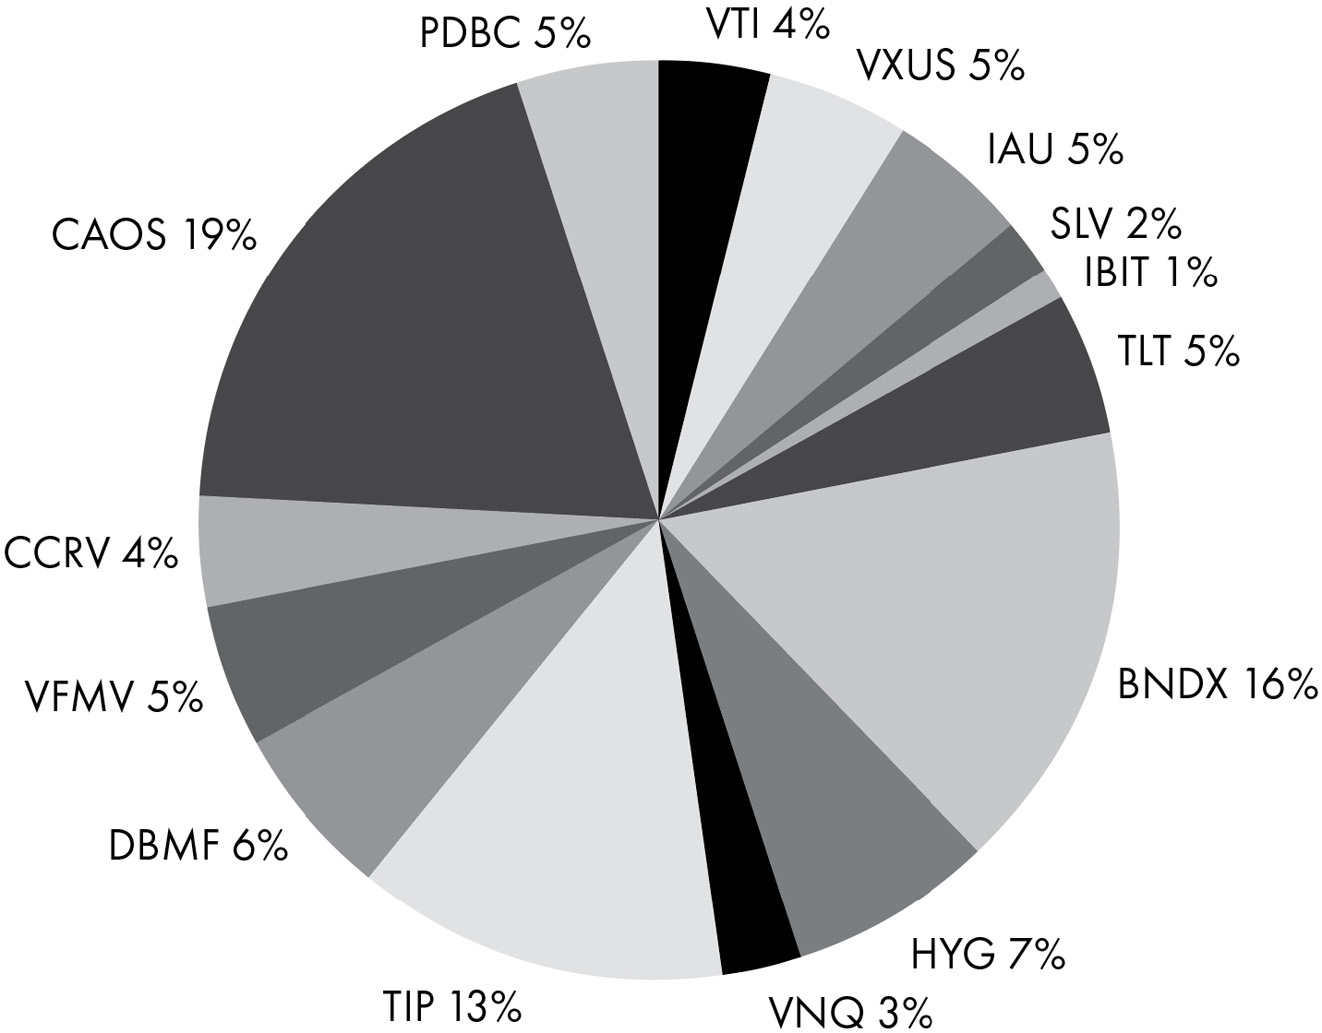
Without using leverage, that gets us to a parity of holdings based on the risk exposures of each asset in the portfolio, as shown in Figure 8.3.
Figure 8.3: Unlevered Risk Parity
Now, even though I’ve oversimplified this approach, this is still pretty complex. Implementing leverage, most efficiently through futures, will make this even trickier and may be an unrealistic approach for most investors trying to do it themselves.
Because of this, it’s usually easier and more efficient to rely on outside fund managers for this kind of strategy. Of course, if you know Ray Dalio then you should just reach out to him about this. Tell him I’d like to talk to him while you’re at it. He’s not currently accepting my phone calls.
Here are some existing funds that implement Risk Parity strategies in a single wrapper:
- SPDR Bridgewater All Weather ETF (ticker: ALLW)
- RPAR Risk Parity ETF (ticker: RPAR)
- AQR Multi-Asset Fund (ticker: AQRIX)
It’s worth noting that Dalio mentioned a simplified version of this strategy in a popular book several years ago. The allocation he recommended was as follows:
- 30% US stocks
- 40% Long-term Treasury bonds
- 15% Intermediate-term Treasury bonds
- 7.5% Commodities
- 7.5% Gold
I was surprised he recommended this as an alternative to Risk Parity given that it’s not true to the methodology he’s referred to in the past. After all, there’s no real parity in this portfolio, especially when you consider that long-term T-bonds are a very high-volatility instrument that oftentimes undergo significant periods of negative real drawdowns.
There certainly hasn’t been parity in Dalio’s simplified portfolio so I’d defer towards the AQR fund and the actual Bridgewater ETF when considering a pure play on this strategy. Therefore, I will ignore Dalio’s simplified portfolio for the sake of this analysis and instead focus on other real-time versions of the strategy that more fully reflect the actual approach.
RISK PARITY PORTFOLIO ANALYSIS
The Bridgewater ETF is very new and hard to analyze because of its infancy, but that’s obviously the most logical way to approach this. That said, the other publicly available versions of the Risk Parity Portfolio haven’t performed all that well in their relatively short histories. But let’s peel back the onion because this one deserves a fair shake.
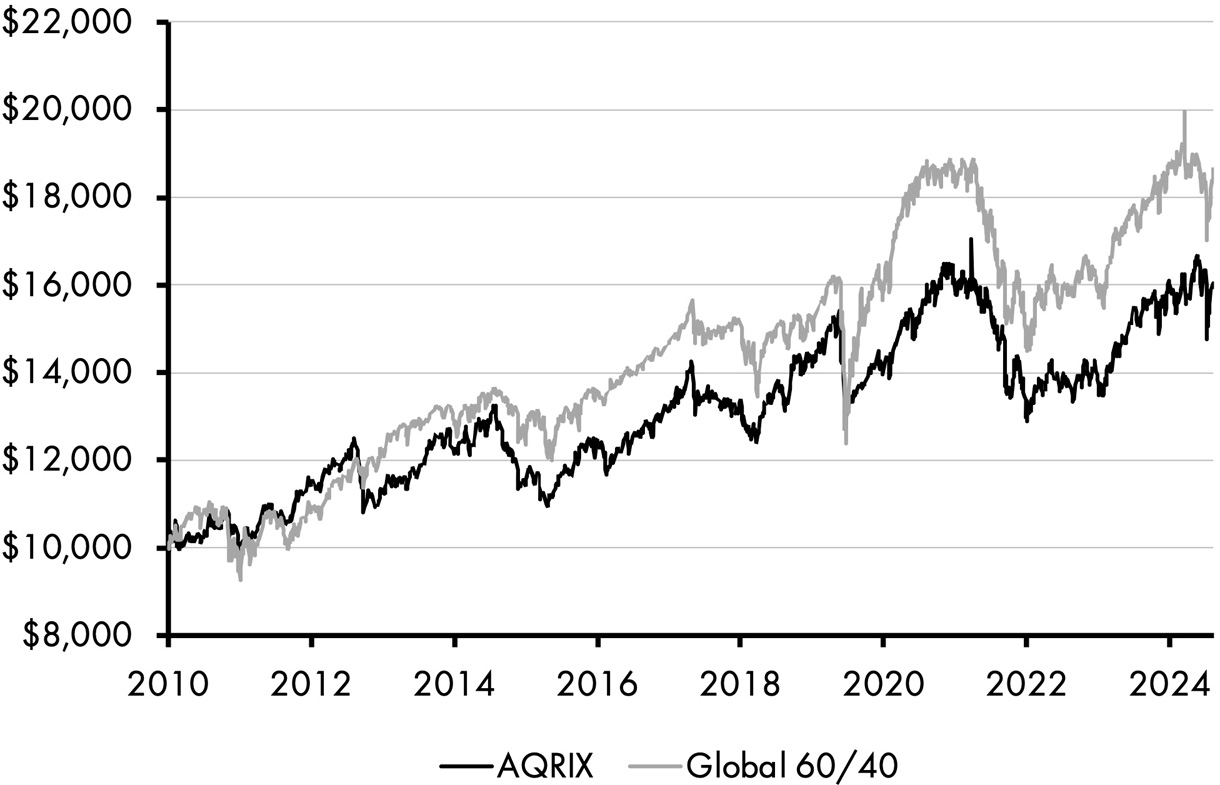
Over the last 15 years, the AQR Multi-Asset fund has generated annual returns of 3.27% compared to 6.93% for the global stock market, as seen in Table 8.1. Of course, we’re comparing a multi-asset fund to a stock fund so this isn’t an apples-to-apples comparison. But it is interesting that the risk-adjusted returns are similar across time. While the AQR fund generated a Sharpe ratio of 0.58, the global stock market generated a Sharpe ratio of 0.56. And the AQR fund had just a 31% market correlation over this period.
When compared to a global 60/40 Portfolio, the Risk Parity strategy generates 3.27% versus 4.37% annual returns, with volatility of 9.02% versus 10.40%.
Figure 8.4: Risk Parity performance
|
RP |
Global 60/40 | |
|---|---|---|
Real Returns | 3.27% | 4.37% |
Volatility | 9.02% | 10.40% |
Sharpe Ratio | 0.55 | 0.59 |
Sortino Ratio | 0.75 | 0.82 |
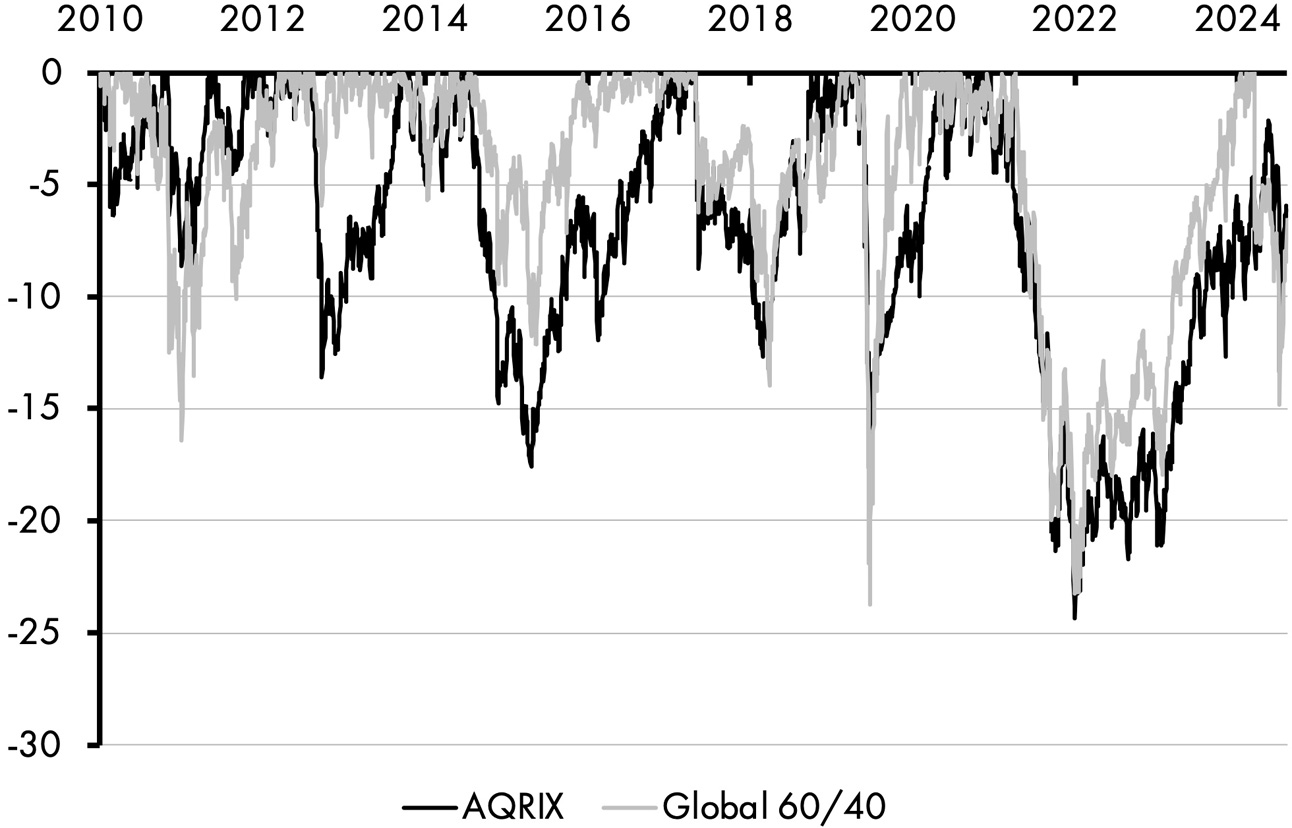
Max Drawdown | −24.11% | −23.73% |
Ulcer Index | 8.97 | 7.00 |
Market Correlation | 0.31 | 0.55 |
The data in Figure 8.5 also shows smaller drawdowns, comparable risk-adjusted returns, and a significantly lower market correlation for the Risk Parity Portfolio compared to the global 60/40 Portfolio.
Figure 8.5: Risk Parity drawdowns (%)
This data is more interesting under the surface than it might appear at first glance. While the performance hasn’t been outstanding, there is a reasonable argument that the Risk Parity strategy creates a unique diversifier in a portfolio that could complement other more aggressive holdings like strictly equities.
Let’s get into the pros and cons.
RISK PARITY PORTFOLIO PROS, CONS, AND LESSONS
As usual, let’s get the good news and bad news out of the way. First the bad news:
- It could be difficult to create your own Risk Parity strategy. This means you might have to rely on higher-fee ETFs or funds to replicate this approach.
- The strategy is likely to experience periods of “diworsification” because it holds so many uncorrelated assets, which can lead to significant return drag – especially when the portfolio leans heavily on non-cash-flow-generating assets like commodities. Without a sophisticated process for assessing risk and return, these portfolios often become so diversified that they produce more stable, but ultimately lower, returns. Real-world evidence seems to support this outcome. Further, the portfolio requires significant turnover and trading. Many instruments in the portfolio could incur high taxes, fees, and leverage costs as a result.
- If you use a fund structure, you’re ultimately relying on the manager’s estimates to navigate returns and assess the relative risk of each asset class. If they adjust those risk assumptions based on expected market conditions, the strategy introduces a significant layer of forecasting risk.
- Leverage creates its own unique risks and embedded costs that can magnify any forecasting errors within the particular Risk Parity methodology.
- There’s a strong argument to be made that these funds are excessively expensive compared to alternative options and that their extra costs don’t outweigh the potential benefits. For example, the new Bridgewater ETF costs 0.85%, which is quite high for a diversified ETF.
What about the good news?
- The Risk Parity Portfolio is extremely diverse and easy to maintain in a single fund structure. Given its very low correlation to the broader stock market it could serve as its own diversifier.
- This portfolio gives you the potential for superior risk-adjusted returns.
- The focus on Risk Parity typically results in lower average volatility, and has the potential for smaller drawdowns and more stable returns over time.
SUITORS FOR THE RISK PARITY PORTFOLIO
I’d argue that the Risk Parity Portfolio is best used as a slice of a broader diversified portfolio. It’s unlikely to outperform stocks over the long run, but it might outperform a traditional 60/40 mix – so it could make sense as a replacement for that portion of your allocation.
This strategy is better suited for investors who either have the expertise to build it themselves or trust someone else to do it well. I would say it’s for the more experienced and adventurous investor who understands the challenges involved and believes those trade-offs are worth it compared to something simpler, like a 60/40 Portfolio.
A portfolio designed to achieve true balance makes a lot of sense. But maintaining asset class parity requires predicting risks and returns, which means the portfolio has to be actively managed – and that involves a fair amount of guesswork.
But what if you could take a similar all-weather approach but implement it with a simpler, more permanent strategy you could set and forget? If you were clever you might call it the Permanent Portfolio. And you guessed it – it’s up next.