The Portfolios
Chapter 4
The Gold Standard of Portfolios — The 60/40 Stock/Bond Portfolio
THE 60/40 stock/bond allocation (the “60/40 Portfolio”) has become one of the most popular portfolios in the world. It is a common benchmark thanks to its consistently strong performance and broad diversification.
But how did this portfolio come to be so widely utilized? Weirdly, no one knows the exact origin story of the most famous asset allocation strategy in the world, but my research shows that the 60/40 Portfolio grew from the ashes of one of the most impactful events in financial market history – the Great Depression.
One of the most important factors that will influence your investment strategy is the environment in which you’re born. Consider an investor who was born in 1910 and was just entering the workforce and starting to earn and save when the Great Depression occurred. When they were 30 years old and in their prime working years, they probably got shipped off to fight in World War 2. From the age of 20 to 35 all this investor knew was a world of horrific turmoil. Little did they know that they had the Korean War, Vietnam War, and Cold War to look forward to as well, before retiring into the inflation trauma of the 1970s. You can only imagine how risk-averse this might make someone.
The Great Depression and the stock market crash of 1929 scarred stock market investors for a long time. No one was writing about 100% stock allocations in the years after the Depression. But following World War 2, optimism soared and the US economy prospered. Corporate America didn’t miss out on the ride and this era formed the bedrock for the industries that many of us now think of as staples of American innovation and production.
When Harry Markowitz wrote his famous 1952 research (as discussed in Part 1), he showed that a portfolio of diversified stocks could help generate superior risk-adjusted returns. He expanded on this work in his 1959 book, Portfolio Selection: Efficient Diversification of Investments, in which he showed that other asset classes, like bonds, could expand the benefits of diversification. Markowitz consistently stated throughout his life that he was a proponent of a 50/50 stock/bond portfolio (as well as factor tilts, which we’ll discuss in Chapter 6). Not because it was necessarily optimal, but because it appeared good enough. He wrote:
. . . I should have computed the historical covariances of the asset classes and drawn an efficient frontier. Instead, I visualized my grief if the stock market went way up and I wasn’t in it – or if it went way down and I was completely in it. My intention was to minimize my future regret. So I split my contributions 50/50 between bonds and stocks.14
Ben Graham, arguably the most influential investor of this era, also discussed how a balanced 50/50 allocation to stocks/bonds would be appropriate for a more defensive investor.15
It’s not hard to imagine why an investor living through this era would come to such a conclusion – a large stock allocation, such as the previously discussed 100% Stock Portfolio, would have appeared reckless to most investors following the experience of the Depression.
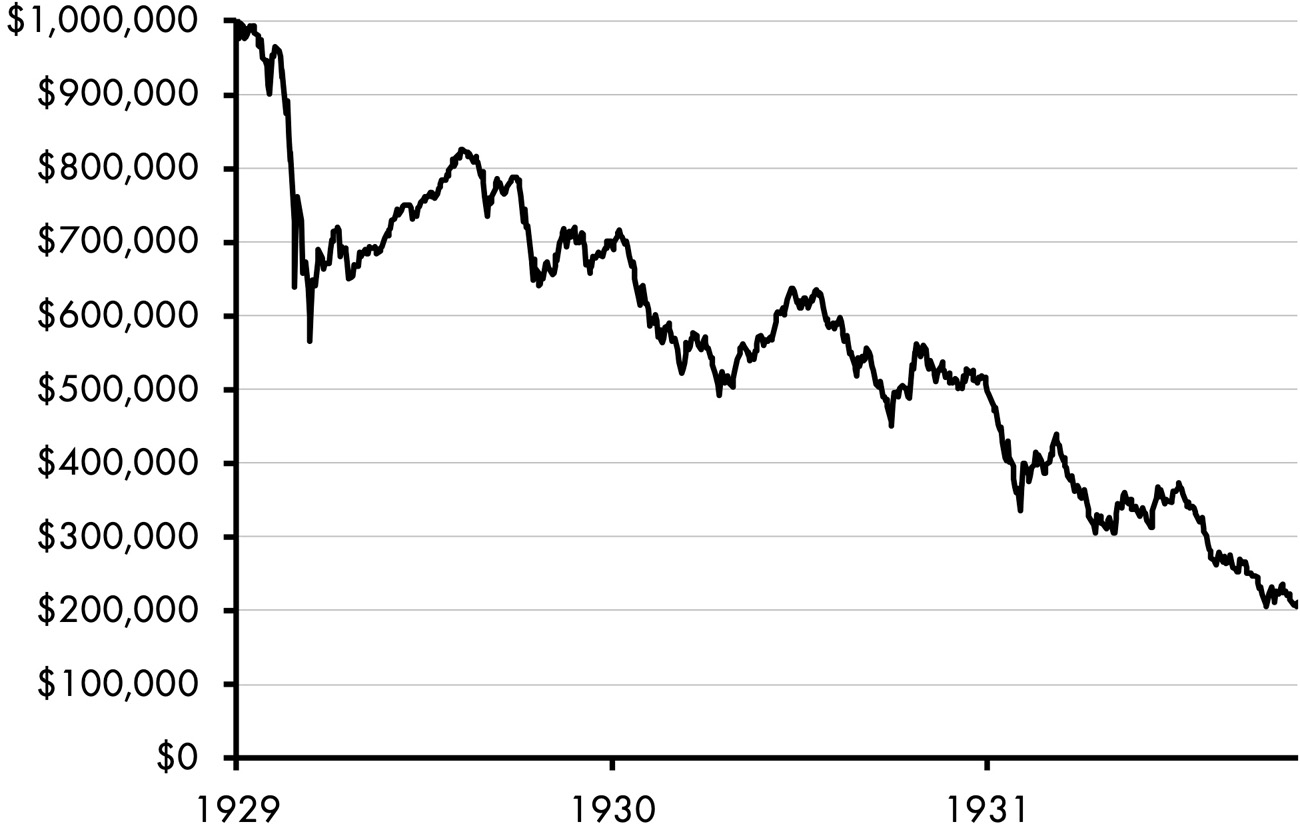
Figure 4.1 provides a look at what happened to a $1,000,000 portfolio during this brutal period. Imagine watching your account balance tick down month after month, eventually falling over 80% over the course of three years.
Figure 4.1: Great Depression US stock drawdown
But as time went on research increasingly showed that a reasonably sized stock allocation could blend well with increased bond exposure to create a balanced style of returns.
Interestingly, this concept was already in practice by a mutual fund called the Wellington Fund, which was formed in 1928 by an accountant named Walter Morgan. Morgan was scarred by his own experience investing in high-risk stocks and preferred a more conservative approach to asset allocation which involved a large bond component. Morgan couldn’t have chosen a much worse launch date for the fund, but it performed well in relative terms thanks to its conservative emphasis, and it attracted assets and attention quickly despite the stock market crash.
In 1944, as the investment management business grew in popularity, the Weissenburger Investment Company began publishing an investment yearbook to track common funds and their benchmarks. The Wellington Fund was a perennially strong performer and averaged an asset position of roughly 60/40 stocks/bonds for the period 1944–1966. As a result of this strong performance the Wellington Fund became its own sort of benchmark over time and this “balanced” methodology became increasingly popular.
In 1949 a young man named John Bogle was working on his thesis at Princeton University. The thesis was a 130-page review of the mutual fund industry and Bogle had some controversial ideas for how the industry could be reshaped, including his claims that the industry “could be maximized by reducing sales charges and management fees.” This was what would famously become Bogle’s Cost Matters Hypothesis and it was arguably the most important insight of Bogle’s career. His alternative perspective on the industry caught the eye of Walter Morgan, himself a 1920 Princeton graduate. Morgan read Bogle’s thesis and eventually hired him to work at Wellington.
After years of success under Bogle and Morgan’s leadership, the Wellington Fund struggled in the 1970s as interest rates rose and the fund drifted from its traditionally conservative strategy, reaching an all-time high stock allocation of 77% in 1971, just before the market peaked. In Chapter 12 we’ll discuss Bogle and the Countercyclical Rebalancing Portfolio and why this sort of allocation drift can be dangerous.
While US stocks generated -1.58% annual returns in the 1970s, bonds fared no better, with US government bonds earning -1.12% annually over the decade. The story had come full circle: after the Great Depression led many to believe stock investing was dead, the inflationary 1970s brought a similar obituary for bond investing. The Wellington Fund eventually settled back into its more traditionally balanced mix of around 60% stocks and 40% bonds. From there, the 60/40 Portfolio had one of the greatest 40-year runs of all time, proving that balanced investing was not only far from dead, but more alive than ever. Wellington and other balanced funds boomed in popularity and the rest is history.
The exact background of the 60/40 Portfolio is lost in time, but it grew in popularity thanks in large part to Walter Morgan, John Bogle, and the formation of the first “balanced” fund. It garnered even greater credibility as Markowitz and Graham advocated for 50/50 stock/bond portfolios and it became cemented as the gold standard of balanced portfolios after Wellington generated decades of stable returns using an approximately 60/40 allocation. The industry not only had theoretical underpinnings for diversification, but also had the historical and empirical evidence that such a strategy could thrive in good times and bad.
WHY DOES 60/40 STOCKS/BONDS WORK?
The 60/40 Portfolio allocates 60% to corporate stocks and balances it with 40% in corporate and/or government bonds. The reason this works is essentially the same reason 100% stocks works – corporations tend to generate profits over time.
At an operational level corporations fund their spending in three primary ways:
- Organic cash flows and revenue.
- Selling equity (stock).
- Selling bonds (fixed income).
Both stocks and bonds are claims on the corporation that give the asset owner a certain right to income and/or profits. Stocks tend to increase in value in the long run because corporate profits tend to rise in the long run. And corporate bonds tend to rise in the long run because the average corporation pays out fixed income to lenders with a moderately low level of default risk. Governments functionally leverage their private sector income and so government bond issuance is viable to the extent that the government is taxing a prosperous underlying private sector.
So, think of it like this – a firm that finances its investment spending by issuing 10-year bonds at 5% will pay its bondholders 5% annual income. Bonds are typically safer than stocks because they pay a fixed amount over a specific term and are awarded a higher claim in the capital structure by contractual design.
Meanwhile, let’s say this firm is growing profits by 10% per year and its stock returns roughly track that growth. An investor who evenly owns both the stock and bond can expect to earn a blended return of 7.5% annually. They are essentially combining a slice of higher risk and higher reward equity with the stability of a 5% fixed income bond. By doing so, they reduce the volatility of the stock portion and still offer a potentially higher return than investing solely in the safer bond instrument.
In the case of the 60/40 Portfolio, this “works” because you’re diversifying across two cash-flow-generating instruments that have very different degrees of safety across time. And many people prefer this type of asset allocation because you’re taking a more “balanced” approach to getting stock market exposure.
Just like Walter Morgan envisioned, you’re taking some stock market risk, but not enough to destroy your financial life in an environment like 1929–1932. Or, similarly, you’re getting some bond exposure, but not enough to ruin you financially in a period of high inflation like the 1970s. The name “balanced” is truly appropriate in this sense.
This type of structure works beautifully in mutual fund or index fund form because the fund can build a very large and diversified portfolio that takes advantage of its scale to reduce taxes and fees. Further, because the fund systematically rebalances to a 60/40 allocation it is inherently risk-managed to maintain a relatively static level of exposure across both the stock and bond markets.
The background is more interesting than you might have assumed, right?
Now let’s talk about how to build this thing.
BUILDING YOUR OWN 60/40 PORTFOLIO
A 60 and a 40. This one’s going to be easy to build, huh?
Yes, and no. Here are some ideas:
- The easiest way to build the 60/40 Portfolio is to buy it within one fund like Vanguard Balanced Index (ticker: VBINX). This is a purely US 60/40 allocation, so it ignores a great big chunk of the global market cap. If you wanted to buy the global 60/40 Portfolio you could buy something like iShares Core Growth (ticker: AOR) which approximates global 60/40.
- Another way to do this is to disaggregate the holdings however you please. For example, you could replicate VBINX by buying VTI (Vanguard Total Stock Index) and BND (Vanguard Total US Bond Market). This is a little more work since you’ll have to manually rebalance back to 60/40 every year, but it has the advantage of giving you more liquidity (you can tap the 40% bonds as needed) and you could potentially harvest losses for tax purposes in a taxable account. And if you really wanted liquidity, you could break out the 40% bonds into another slice where, for example, you took 30% BND and purchased a more liquid 10% allocation in T-bills or a short-term bond fund such as SPDR T-Bill ETF (ticker: BIL). This has the added advantage of giving you a more liquid holding in case you might need it. Think, 60/30 plus 10% of T-Bill and Chill.
So yeah, that is pretty simple after all.
Now let’s look under the hood to get some perspective on why this portfolio is so popular.
60/40 PORTFOLIO ANALYSIS
What you’ll notice with this portfolio is that it is true to its name – it creates much better balance when compared to a pure stock or bond portfolio. I couldn’t simulate a broad bond index much further back than 1960 before the data starts to look a bit unreliable, but we have 60+ years to assess.
This portfolio does roughly what we’d expect. It beats bonds, but underperforms stocks. While stocks generated 6.28% per year, the 60/40 Portfolio does 5.00%.
Figure 4.2: US 60/40 stocks/bonds
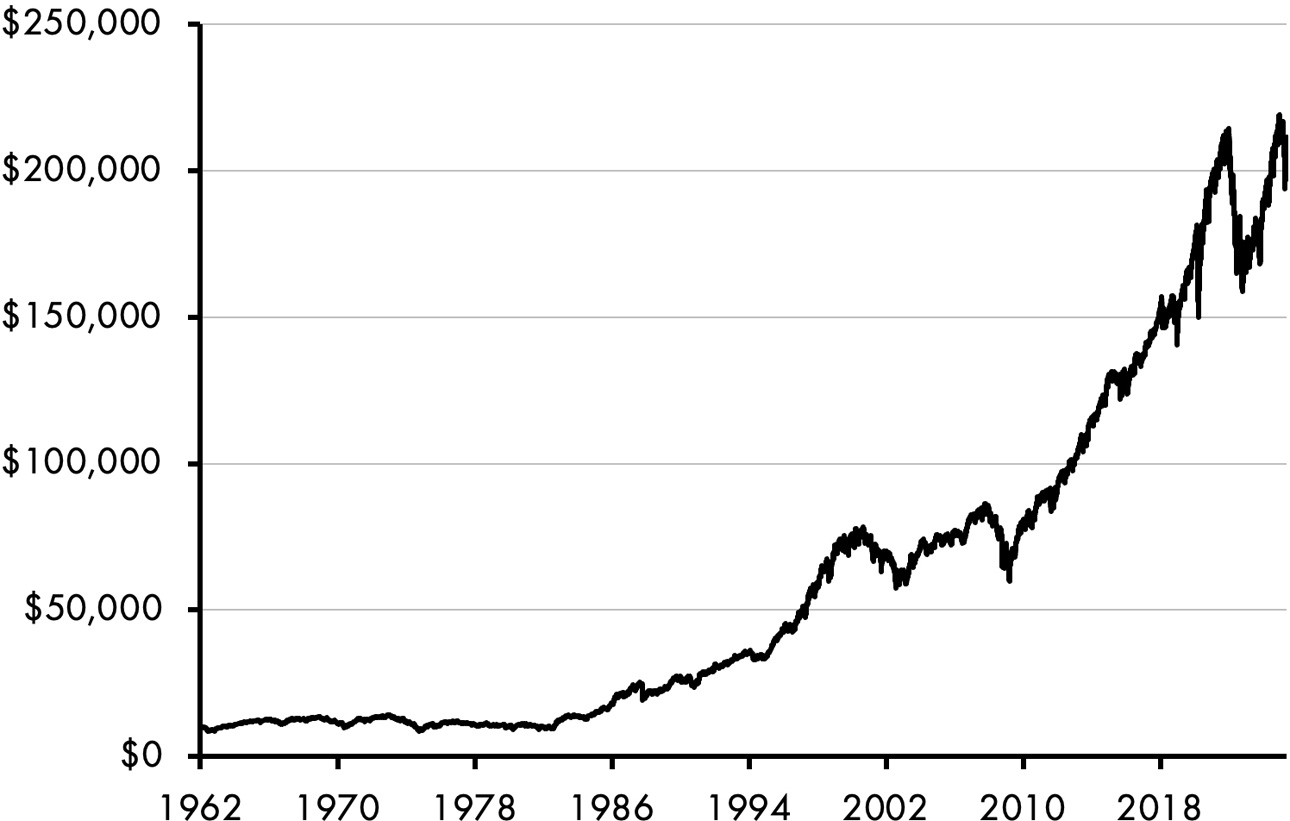
Table 4.1: Portfolio analysis (1962–2025)
|
US 60/40 |
100% US Stocks | |
|---|---|---|
Real Returns | 5.00% | 6.28% |
Volatility | 9.95% | 16.52% |
Sharpe Ratio | 0.47 | 0.41 |
Sortino Ratio | 0.66 | 0.58 |
Max Drawdown | −39.50% | −58.21% |
Ulcer Index | 12.13 | 19.11 |
Market Correlation | 0.58 | 1.00 |
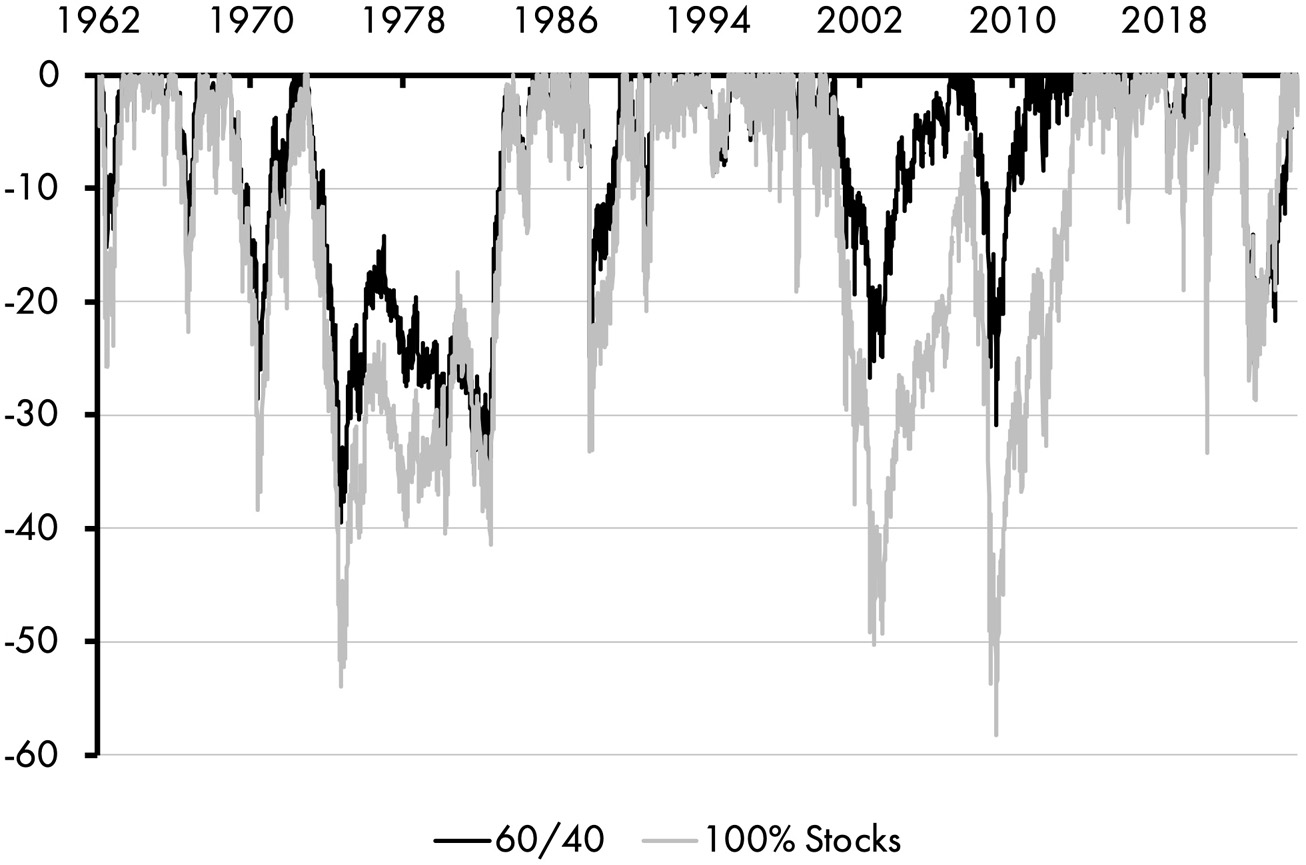
Importantly the volatility is 9.95% compared to 16.52% for stocks and the Ulcer Index is 12.13 over this period compared to 19.11 for stocks. The max drawdown is -39.50% compared to -58.21% for stocks, so this portfolio is less volatile, but still has a decent amount of downside exposure.
Figure 4.3: US 60/40 max drawdowns (%)
60/40 PORTFOLIO PROS, CONS, AND LESSONS
Well, this portfolio seems like a no-brainer, huh? But don’t put the book down just yet. It’s not all good news. First, the cons:
- The 60/40 Portfolio is a homogeneous mix of time horizons. When you blend stocks with bonds what you’re really doing is diversifying across time horizons and assets. You’re taking inherently long-term assets and mixing them with shorter-term instruments. This is great, but it may create homogeneous portfolio risk if your portfolio holds short-term assets that you cannot liquidate without also liquidating your long-term positions. In other words, if you own a diversified 60/40 mutual fund and you need liquidity from it, you cannot only sell the short-term bonds in the 40% piece because your redemption results in selling a bit of the entire portfolio. That’s not ideal and so disaggregating the portfolio is important if you need liquidity.
- The 60/40 Portfolio isn’t as “balanced” as it might look on the surface. A 60/40 Portfolio is diversified across asset classes, but the more volatile (larger) allocation skews the risk in the portfolio. We often refer to the 60/40 Portfolio as a “balanced” portfolio, but the risks are not equally distributed between the assets. In fact, the stock market has a standard deviation of 18% on average, while the bond market has a standard deviation of just 6%. When you consider where your volatility comes from in this portfolio you are getting 75%+ of the portfolio’s volatility from its 60% slice. For instance, in a year like 2008 the 60/40 Portfolio falls 30% because its volatility is driven primarily by the stock allocation even though bonds were positive that year! In that sort of extreme environment 100% of the negative volatility comes from the 60% slice.
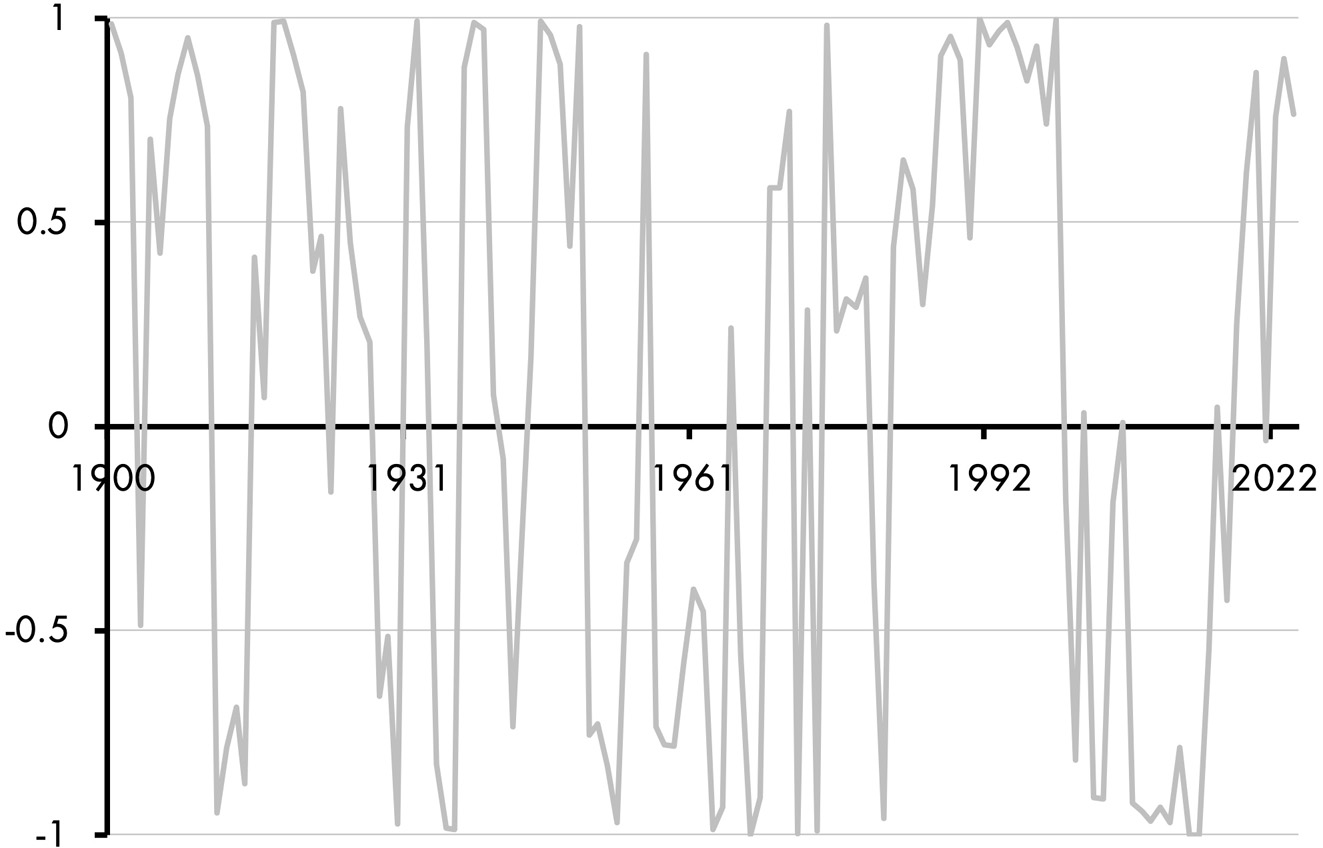
- The 60/40 Portfolio might not provide you with enough diversification in certain environments. There will be many times when stocks and bonds become highly correlated. If both asset classes happen to rise and fall in tandem, you’ll need something else to give you more stability. This was especially important in the 1970s and then again in the post-Covid inflation years when bonds did not do a great job of hedging negative stock market volatility. Figure 4.4 shows the historical correlation of the two assets; as you can see, it is not static!
- A purely domestic 60/40 Portfolio could expose you to a lot of domestic economic and currency risk. This is one reason to consider a global 60/40 Portfolio or adding more global diversification around a domestic 60/40 Portfolio.
Figure 4.4: Stock/bond correlation (three-year rolling)
Let’s not be too negative though. Now the pros:
- The 60/40 Portfolio is highly diversified, yet simple.
- The 60/40 Portfolio is low-cost, tax efficient, and can be purchased using just one fund or split up across a handful of funds.
- A diversified multi-asset holding like this is a fantastic core holding in a portfolio. When it’s surrounded by planning-based satellites (insurance holdings, cash/liquidity holdings, and growth tilts) there’s not a whole lot else someone needs.
- Using my Defined Duration methodology a 60/40 Portfolio is roughly a 12-year instrument so it’s not short like cash or T-bills, but also not super long like stocks. It’s a good inbetweener if you’re thinking about this across specific time horizons.
SUITORS FOR THE 60/40 PORTFOLIO
This portfolio is great for anyone who values balance in their positioning. They want to own stocks, but don’t want the full volatility of the stock market. I like to think of the 60/40 Portfolio as a Goldilocks portfolio.* It’s not too hot and not too cold.
You also have to remember that this might not be suitable as your entire portfolio in case you need liquidity or want other more aggressive holdings on the satellites of your portfolio. So, in theory this portfolio could be a great core holding for almost anyone, but it may need to be complemented depending on your needs.
FINAL THOUGHTS
The 60/40 Portfolio has earned its great reputation. But it’s not a relevant benchmark for most of us because it deviates quite a bit from the broader market.
Speaking of benchmarks – if we wanted to construct the benchmark that is most relevant in the world of investing it wouldn’t be the 60/40 Portfolio. It would be the portfolio that reflects the outstanding market value of all stocks and bonds.
This portfolio is behind Door #5 so keep reading because it’s arguably the most important portfolio in the entire world.