The Portfolios
Chapter 5
The Global Financial Asset Portfolio
DURING the GFC I remember reading the prospectus for a new ETF designed to replicate hedge fund strategies. The fund described itself as a “passive” investment fund that was benchmarked to a certain hedge fund index.
What the heck?
This hedge fund ETF made something clear to me – anyone can create an index of their preferred strategy and then start an ETF that tracks that index. The fund is technically “passive” in that it does not actively change its holdings in a discretionary manner, but simply tracks the index, even if that index is a custom index that is super active under the surface.
The idea of “passive investing” took on a different and murky meaning for me from that moment, and I realized that the term wasn’t as black and white as I’d always thought. After all, in what world could a hedge fund strategy charging high fees be considered “passive” in the way we’ve all come to understand the term? Surely it couldn’t just mean inactive. And it couldn’t even mean indexed.
The context in which we discuss the term “active” relies heavily on the specific benchmark we’re using. As I’ll discuss later, benchmarks are used and abused all over the place. For the purposes of tackling the active versus passive debate, I needed to first identify the most relevant index. After all, we call the S&P 500 a benchmark, but it’s certainly not a passive one because it’s only 500 stocks out of thousands in the world. It very actively deviates from the broader market. And it deviates massively from something like the 60/40 Portfolio which can be comprised of thousands of stocks and bonds.
As I did more research it occurred to me that at the aggregate level, there is only one portfolio that represents the market value of all outstanding financial assets – the Global Financial Asset Portfolio (GFAP). No one really owns this portfolio in its perfect form because it’s impossible to replicate exactly and there are many rational reasons to deviate from it. But this portfolio is as close as we’ll ever get to “the market portfolio” or a truly “passive” asset allocation since it reflects the actual outstanding value of global stocks and bonds without discretionary or active deviations.
NOT SO FUN SIDE STORY
I was once on the phone with my counsel and an SEC examiner discussing a potential fund launch, when I found myself in a semantic debate about active versus passive investing in which I tried to convince the SEC examiner that his distinction between the two didn’t make much sense. My counsel interrupted me after a 10-minute rant and said, “Cullen, I charge by the hour so could you give me more detail about your views on passive investing – I have all day.” What a funny guy. I promptly shut up, but then spent the next few years on my own less expensive quest to pin down the controversial subject of active and passive investing.
At a broad level, there’s really no such thing as purely passive investing. There are only degrees of active decision-making – some of them potentially harmful, like high-fee day trading, and others quite beneficial, like low-cost indexing. But this search to pin down a semantic (though important) word led me to the GFAP, which is a much more interesting allocation than you might think.
The simplest version of the GFAP takes the two largest asset classes (stocks and bonds are the largest financial asset classes by a large margin) and breaks them down by their outstanding market capitalization – the market value of all outstanding stocks and bonds in the world. If you wanted to own the one true passive “market portfolio” or what efficient market theorists might call the “efficient market portfolio” you would want to own this asset mix because it reflects the value of what “the market” holds in aggregate.*
WHY THE GLOBAL FINANCIAL ASSET PORTFOLIO WORKS
The Global Financial Asset Portfolio is comprised of global stocks and bonds in accordance with their current market capitalization. An investor in this portfolio is buying all publicly available stocks and bonds that have been issued.
The reason this portfolio works from an operational level is because it is the market portfolio. It is the ultimate benchmark portfolio and the portfolio that every passive investor would buy if they were trying to be truly agnostic to any market tilt.
Although the GFAP is a deviation from something like the 60/40 Portfolio, it works in the long run for much the same reason – stocks and bonds tend to generate positive returns over the long term because the underlying entities tend to grow, innovate, and pay out income over time. One could also argue that this portfolio is efficient in that it would require fewer transaction costs compared to other more active deviations because it more closely tracks what the markets do over time.
The GFAP sounds simple, but when you peel back the layers of this onion you find something increasingly controversial and complex.
Let’s get into it.
BUILDING YOUR OWN GFAP
Building the GFAP is not quite as easy as you might think and I spent years going down different rabbit holes over this one. In fact, there’s even controversy over what should be included in the GFAP.
An index fund provider must construct an index that is investable and can be publicly replicated. There’s a big problem there – all issued assets aren’t necessarily investable. For example, China has dual share classes in its stock market where much of the market cap of Chinese stocks ends up not being investable for foreign investors. More recently, central banks have become large purchasers of government bonds and stocks. As a result, you might argue that these assets aren’t “investable” as they’ve been taken out of the public markets.
How does an index fund provider replicate these asset allocations when the actual assets are not always available to be purchased? Or if a central bank or government removes assets from the private sector, how do we account for the actual outstanding assets held in the economy? This has created a debate in academic circles about whether to synthetically replicate these allocations or stick to a strict investable methodology.
Interestingly, index funds like the Vanguard Total World Stock Index adhere to a pure investable methodology (also referred to as a free float methodology). This is noteworthy because the investable universe of stocks can differ significantly from the total actual outstanding market capitalization of these instruments.
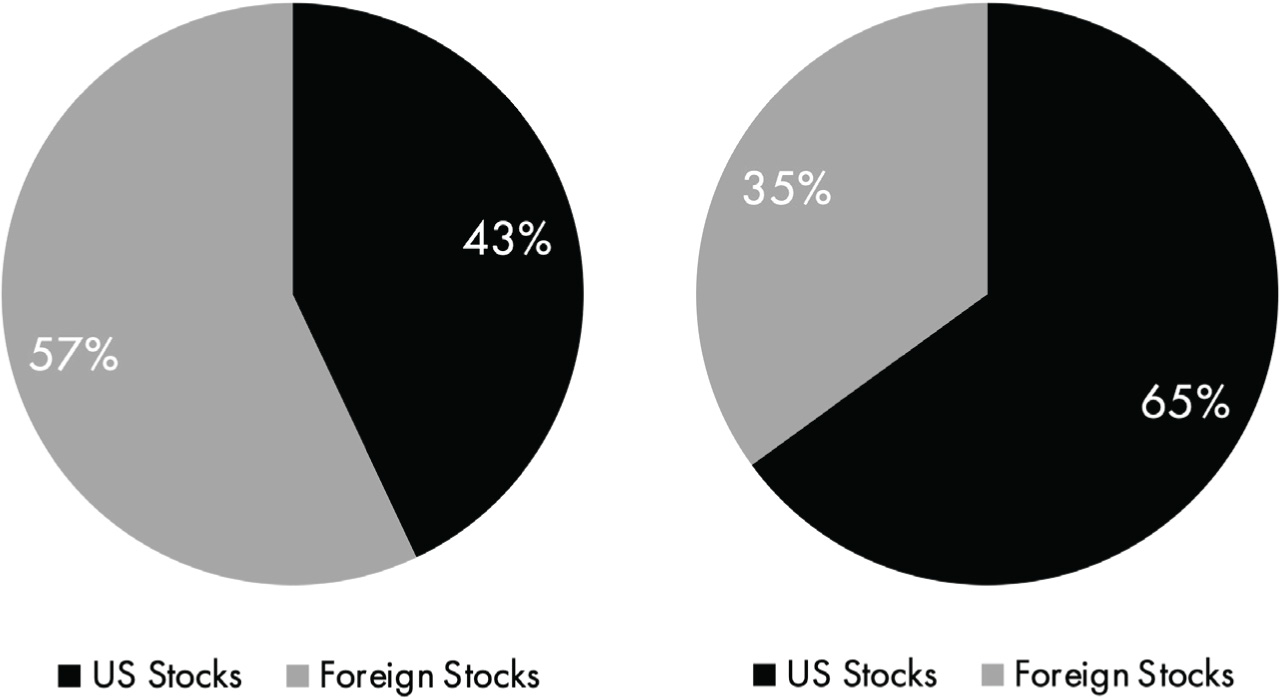
For instance, based on the investable universe, the global stock market is approximately 65% US stocks and 35% foreign stocks. But when you consider the total outstanding market capitalization, those figures flip to approximately 43% US and 57% foreign (see Figure 5.1). This is no small difference, especially when you consider the portfolio from the perspective of a US-based investor who already has concentrated domestic economic risk.
Figure 5.1: Full market cap versus free float investable market cap
The most comprehensive research on this topic comes from Elroy Dimson and Paul Marsh. I spoke with Dimson and he didn’t express a strong opinion about what was the better approach to implement, although he mentioned he uses the investable universe for the sake of practical implementation. But he also highlighted a fact that I found staggering.
If you utilized a full cap weighting instead of the free float investable universe, emerging markets would DOUBLE in size. This is because less than 50% of the market cap of China, India, and Russia is investable. Incredible. It might make you wonder if we’re all massively underweight emerging market stocks just because of a somewhat subjective definition of global market cap weighting.
In any case, I find the free float versus full cap distinction interesting for several reasons:
- Someone living in the US who already has significant domestic economic bias might be exposed to even more home bias than they think by owning the investable market cap.
- Does it make sense to be overweight the largest economy in the world when the future empires of the world are likely to look very different as China, India, and other emerging markets converge with the West?
- The domestic US investor has significant dollar exposure, which is exacerbated in a US-heavy asset allocation.
But it gets more interesting.
What about the bonds?
This gets even messier because so much of the global bond market is now owned by central banks following decades of quantitative easing (central banks buying assets to stimulate the economy). How do we treat that? Should we care? Or do we just swap the bonds with the “monetized” cash holdings? And then there are all the asset-backed securities available for purchase like commodity funds and other alternatives. This. Is. Getting. Complex.
I prefer to keep it simple with stocks and bonds and then measure the allocations in their true full, outstanding market capitalization since that reflects assets that have been issued, regardless of whether they’re “investable” or not. I don’t believe we should ignore certain assets just because they’re not readily tradeable. After all, they were issued for some economic purpose and serve a real-world financial need. It’s not as if they don’t exist so, where we can synthetically replicate that allocation, my view is that we should. If the goal here is to own the world’s outstanding financial assets, then our portfolio should reflect what has actually been issued. Large index providers, by contrast, rely on the investable universe because they need to build indices that can be tracked and replicated in practice.
But since this is my book, let’s go with full market cap since that’s the value of the assets that actually exist in the real world. This data is publicly available and easy to replicate using the SIFMA Capital Markets Fact Book that is issued annually and updated quarterly.16 The World Federation of Exchanges also issues the stock market data publicly, but you’ll have to calculate the relative sizes on your own.17
As of 2025, the full cap global stock and bond markets can be broken down as follows:
- Total stock market capitalization: $115 trillion.
- Total bond market capitalization: $141 trillion.
- That’s 45% stocks and 55% bonds.
Within each stock and bond sleeve the US versus foreign breakdown looks like this:
- US stocks: 43%
- Foreign stocks: 57%
- US bonds: 39%
- Foreign bonds: 61%
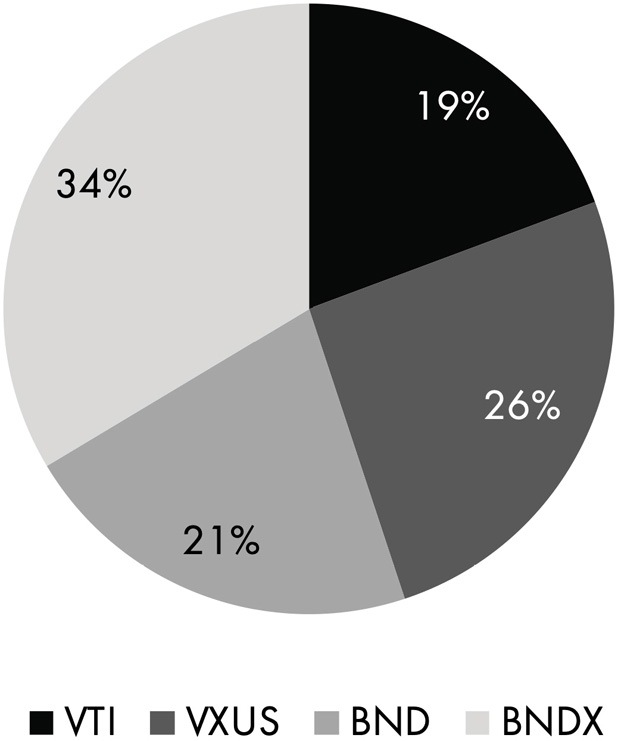
Owning this portfolio is easy. If you wanted a clean four-fund allocation, you’d own something like this:
- Vanguard Total Domestic US Stocks (ticker: VTI): 19%
- Vanguard Foreign Ex-USA (ticker: VXUS): 26%
- Vanguard Total Domestic Bonds (ticker: BND): 21%
- Vanguard Total Foreign Bonds (ticker: BNDX): 34%
This is illustrated in Figure 5.2.
Figure 5.2: The GFAP
There it is. That’s your super simple four-fund GFAP. Update it every year and you have a nice clean total market portfolio.
GFAP PORTFOLIO ANALYSIS
One of the interesting things you’ll notice about this portfolio is that it’s adaptive. Its allocation changes dramatically over time, in large part because the stock market booms and busts and drives big changes in relative values. Figure 5.3 shows the historical allocation of this portfolio since 1990.
Figure 5.3: GFAP stock/bond weights over time
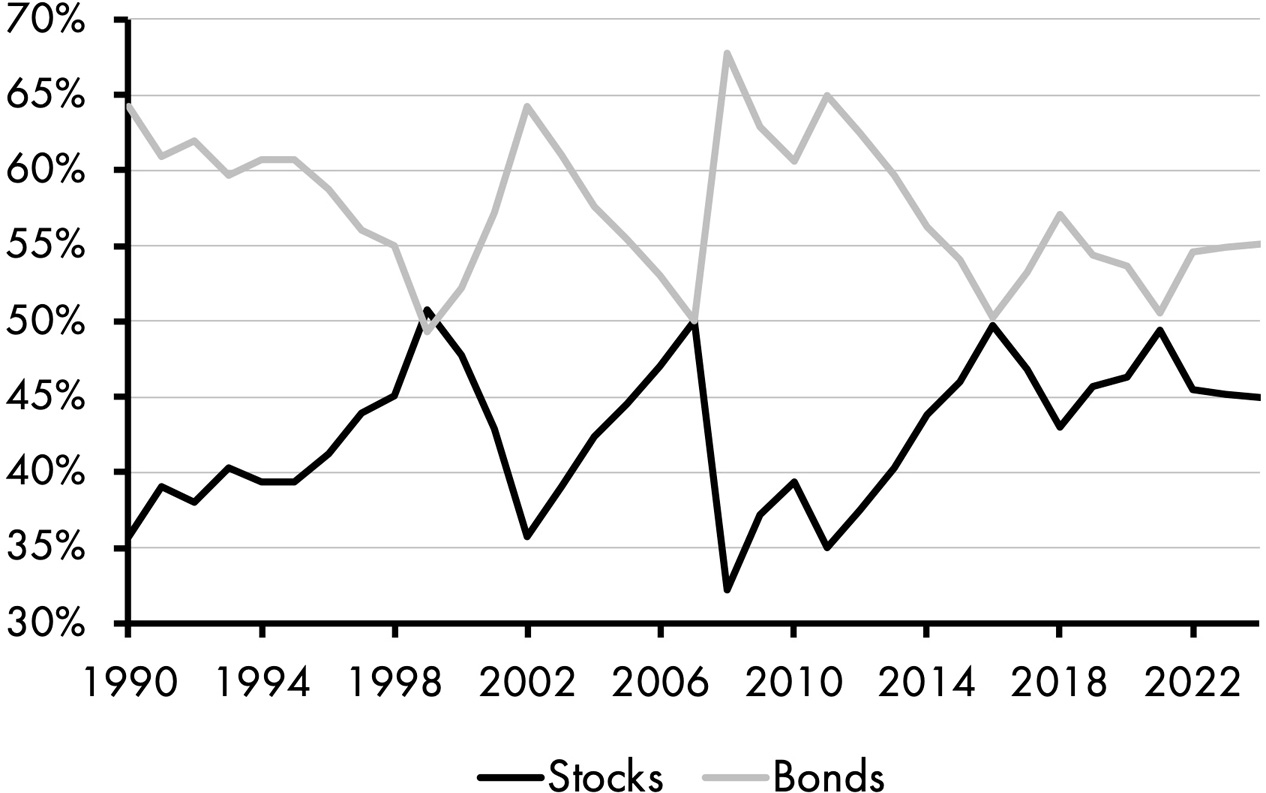
This portfolio is consistently underweight stocks relative to bonds because the bond market has historically been larger, primarily driven by new bond issuance. I focused on the period from 1990 to present because that’s when we began to see reliable real-time data and more accurate tracking of foreign market performance.
During this period, the GFAP would have generated 4.05% real returns with 8.31% volatility, compared to a global 60/40 Portfolio, which generated 4.34% with 9.53% volatility.
Figure 5.4: GFAP historical total real returns
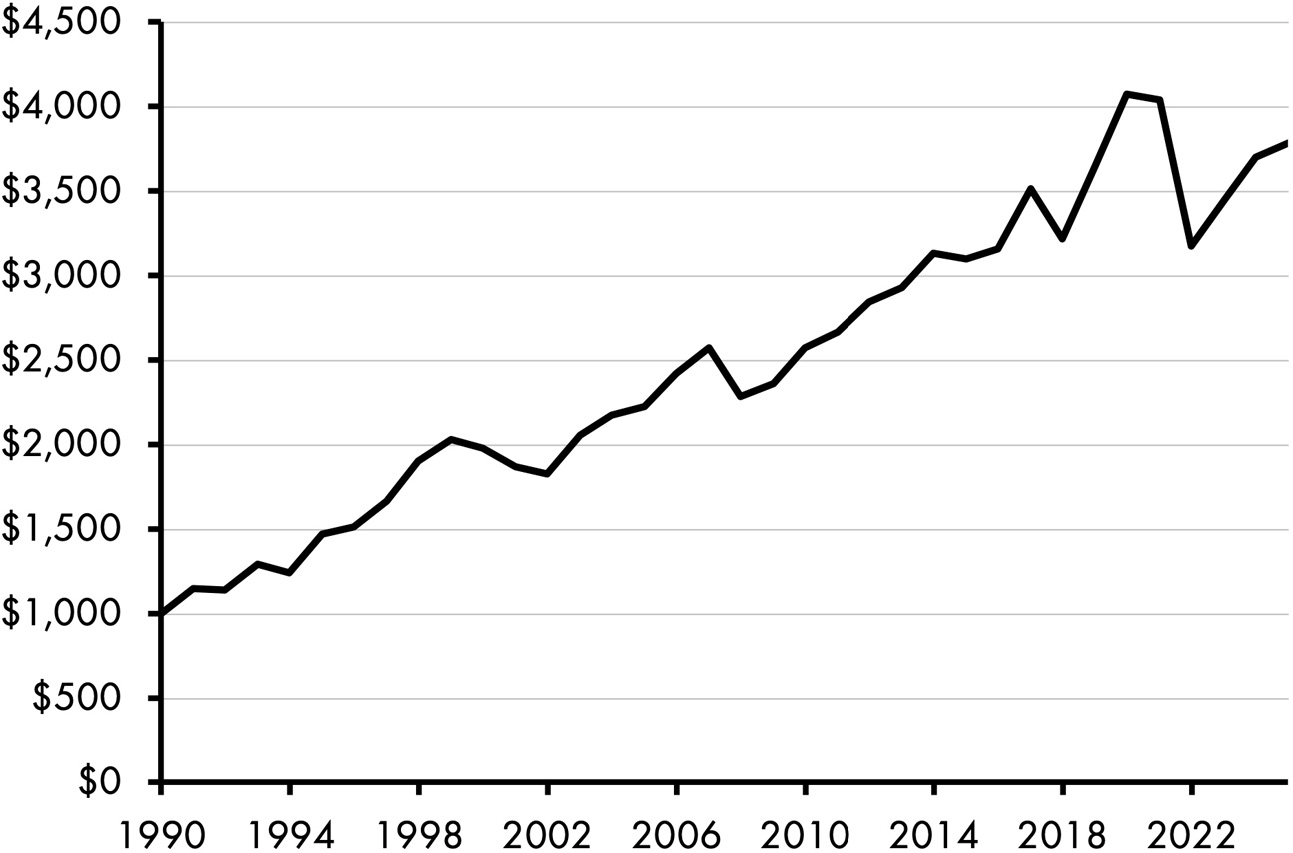
Table 5.1: Portfolio analysis
|
GFAP Portfolio |
Global 60/40 | |
|---|---|---|
|
Real Returns |
4.05% |
4.34% |
|
Volatility |
8.31% |
9.53% |
|
Sharpe Ratio |
0.45 |
0.47 |
|
Sortino Ratio |
0.55 |
0.66 |
|
Max Drawdown |
-27.62% |
-33.42% |
|
Ulcer Index |
12.13 |
8.91 |
|
Market Correlation |
0.52 |
0.47 |
An interesting fact about the GFAP is if you invert the allocations performance actually improves, even in risk-adjusted terms. In other words, if you swapped the stock and bond weights, using the stock percentage as the bond allocation and vice versa, returns increased to 5.20% per year with only a modest increase in risk.
I suspect this outperformance is due to both the added risk and a reduction in procyclicality. The GFAP is inherently procyclical, meaning it tends to become most heavily weighted in stocks during market booms – right before major downturns. By inverting the allocations and creating a countercyclical mix (a strategy we’ll discuss in Chapter 12), you still maintain significant stock exposure, but you are taking that risk more strategically. The stock allocation shrinks as valuations rise and risk builds, giving the portfolio a defensive tilt as markets boom and become potentially riskier. The GFAP, on the other hand, tracks the stocks market’s big booms as market caps expand and benefits from long bull markets such as the 90’s bull market, but is positioned in the worst possible way before the big devastating bear markets like the dot-com bust and the GFC. Interesting, huh?
GFAP PROS, CONS, AND LESSONS
Let’s talk about the good and the bad. As always, here’s the bad news first:
- The GFAP is difficult to define and can be measured in different ways depending on subjective preference.
- The GFAP isn’t a “beat the market” strategy as it is, by definition, designed to track the market. This might be a pro, but depending on the reader it could be viewed as too boring or too conservative given its consistently large bond allocation.
- Owning foreign bonds is questionable in my view. Foreign bonds are generally much more volatile than US government bonds because many foreign governments and their economies are more unstable. This means that foreign bonds can often behave like stocks in disguise, especially during periods of turmoil when the goal of bonds is stability. Then again, if the point is to take what the market gives us, then this is something we’d accept as truly passive.
- The GFAP is comprised of only stocks and bonds, so it can experience periods of turbulence when those two asset classes become highly correlated. It also includes only financial assets, meaning it excludes a range of alternatives that could offer additional diversification.
- Some might argue this isn’t a truly “efficient market” portfolio because it includes instruments like government bonds – assets that don’t always reflect private market forces, but rather what governments choose to issue (or impose). That’s a fair critique, though it quickly leads us into a deeper debate about what we even mean by “free market.” Who wants to argue with me about this on the internet? I’ll remind you that I don’t sleep much.
- It’s interesting that inverting the GFAP generates better returns. It might make one wonder whether this is such an “efficient” portfolio, after all.
And what about the good news?
- The GFAP is incredibly clean, simple, diverse, low-fee, and tax efficient.
- The GFAP offers a simple global asset allocation that closely reflects the market portfolio of outstanding financial assets.
- This most closely represents a pure passive or efficient market portfolio, ideal for investors who want a neutral approach that simply mirrors the market’s own asset weights without making allocation calls.
SUITORS FOR THE GFAP PORTFOLIO
The GFAP is a great option for investors who want a low-maintenance portfolio that holds something close to the efficient market portfolio. With a cash or T-bill component it can serve as your entire investment strategy. But remember that this approach is never going to knock your socks off. It’s designed to take what the market gives us, not to beat it.
This approach is best suited for someone who values global diversification and strongly believes in the efficient market hypothesis – someone who sees little reason to deviate from the total market portfolio.
FINAL THOUGHTS
If the Global Financial Asset Portfolio is the ultimate efficient market portfolio, then it would only be appropriate to consider something more active, right?
When Gene Fama developed the Efficient Market Hypothesis, he had to confront the reality that certain components of the market appeared to consistently outperform. After all, how could an inverted GFAP outperform the GFAP if markets were truly “efficient”? To explain this, Fama concluded that there are specific “factors” that drive excess returns. Those factors are behind Door #6.